From Visual Analytics and Applications
Jump to navigation
Jump to search
 ISSS608 Assign ChenNannan-MC2
| Statement |
Graph |
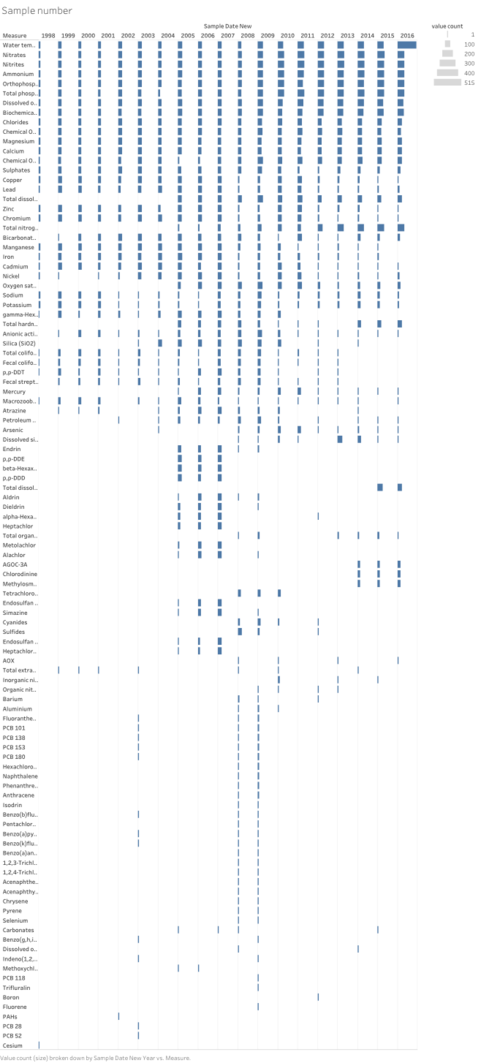
| The study of total dissolved salt, total nitrogen and total hardness started in 2005 and increased these years. And the sample number of anionic is become less these years. Total coliform and Fecall coliform sample decrease recent year. In the future, the sample of Total dissolved phosphorus, AGOC-3A, Chlorodinine, Methylosm might increase in the future.
|
|
| The data is discrete which is hardly to study the pattern of time series and the whole trend. Besides, the high volatility nature of data and outliers make it difficult to scandalisation and study the record. The Hydrology Department are not collecting the sufficient data. I think that the data need to be more structure collected. For example, the same measure need to be test at one time from different location which can be easier to comparison.
|
|
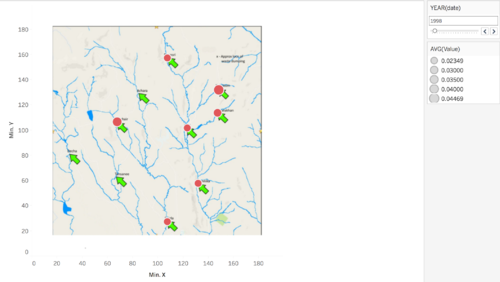
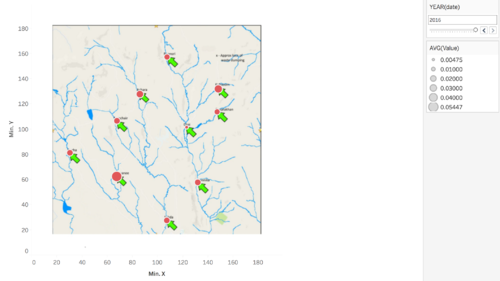
| In 1998, the pollution is severe in east area. And the west area is lack of record and investigation. From 1998 to 2008, the volatility is large which show the instability of the values. From 2008 to 2016, the pollution of east areas has been controlled. However, the chemical in west area has increased. Therefore, I think the treatment of pollution need to be focused. In addition, the sample strategy need to be improved to apply control variable method to study the pollution of water.
|
|


