ISSS608 2017-18 T1 Assign Fam Guo Teng Hypothesis of Transmission
|
|
|
|
|
|
Contents
Hypothesis
To explore the hypothesis that the epidemic is caused by the truck accident that occurred near the I-610 bridge further, a bubble plot was created using SAS JMP Pro 13 to visualize the data. The microblog time intervals within the bubble plot have also been aggregated into fifteen minute intervals for easy viewing.
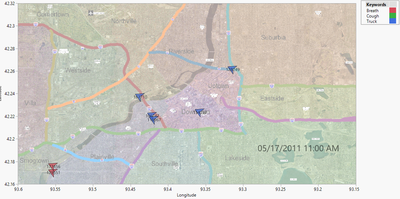
Using the keywords, ‘truck’, ‘cough’ and ‘breath’, the following figures show how the respiratory-related microblogs appear during certain timings.
During the truck accident, there were also some reports of an explosion in Smog Town (lower left corner) that caused some breathing fears. But these were red herrings and were ultimately not responsible for the epidemic. Figure 4 already showed some reports near I-610 about the truck accident by nearby witnesses.
Figure 5 shows the increased number of truck accident microblog accounts approximately two hours later. Witnesses also report about the truck being on fire and its cargo was spilling out, likely to be into the nearby Vast River.
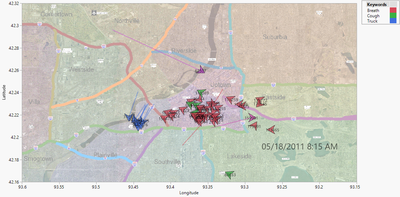
By approximately 8:00 AM on 05/18/2011, there were reports of people suffering from respiratory-related symptoms shown in Figure 6. The truck fire fumes had some time to be blown over to the Downtown area, that has a daytime population of 258,928 people. This event also unfortunately coincided with a basketball game held at the Vastopolis Dome, and a technology convention at the Capitol Building. With such a large crowd, it was easy for many people to get affected by the airborne infection.
Figure 7 shows the height of the airborne transmission rates, overlapped with microbloggers with vested interests in the convention and the basketball game.
Figure 7b shows the same perspective as Figure 7, but without the basketball and convention event information. This gives a closer view that the airborne transmission fans out in a cone-like shape, with a higher density of data points near the I-610 bridge, with decreasing density away from that point. This further shows that the origin point of this airborne infection begins at the bridge and is transmitted airborne via the westward winds.
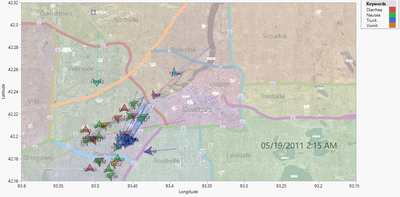
Shortly after the reported respiratory symptoms, the Vast River downstream area also showed some activity. Figure 8 displays the first reports of multiple gastrointestinal related problems, and they have mostly amassed near the river banks downstream of the truck accident south of the I-610 bridge location. This trend has been plotted based on the keywords ‘diarrhea’, ‘nausea’, ‘truck’, and ‘vomit’. Oddly enough, the people microblogged about the initial truck accident are now travelling towards I-124 where they will blog about another accident there later.
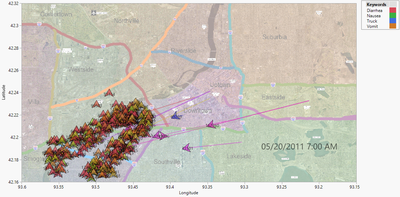
The reports continue to increase (Figure 9) around the downstream river banks until the end of date 05/20/2011, where they slowly dwindled. Since residents and businesses both use the Vast River as a source of drinking water, it makes sense for them to be infected and display these symptoms around the river bank area.
By late afternoon of 05/20/2011, many people with infected respiratory symptoms sought help in hospitals situated at various points on the map, microblogging along the way as evident by their trails (Figure 10). The convention and basketball game in the Downtown area had also finished by now. The people with gastrointestinal symptoms mostly stayed within the vicinity.
People-to-people Transmission
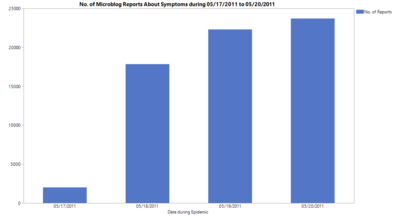
But what about the likelihood of people-to-people transmission? Looking at the number of microblog messages about infected symptoms in Figure 11, there was not much change during the critical three-day period from 05/18/2011 to 05/20/2011. There was however, a lag period of about a day from its initiation stage, before the list of symptoms start showing up in microblogs. This could be due to a possible incubation period synonymous with most common flus, or it could be due to the relatively light wind speed and slow river current that has carried the potential pathogens to the people in Downtown area and downstream of the Vast River.
If people-to-people transmission were present, the number of infected people accounts would have increased dramatically based on the population density data, and not maintained at just a relatively small range of approximately 20,000 microblog posts. Therefore, there were only two different infections identified and none were transmitted via people-to-people transmission.

