ISSS608 2017-18 T1 Assign Fam Guo Teng Containment and Resource Deployment
|
|
|
|
|
|
Contents
Outbreak Containment
Based on the previous hypothesis section, we have identified two main transmission methods of the current outbreaks.
- Airborne transmission causing Respiratory-related symptoms
- Waterborne transmission causing Gastrointestinal-related symptoms
To find out whether both respiratory and gastrointestinal epidemics have been contained, we need to investigate the data trends of these two different situations.
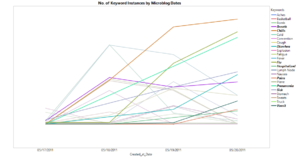
Figure 12 shows the highlighted keywords that have an upward trend in the duration of the epidemic. These keywords are of concern because they might signify the amount of people getting infected is increasing and out of control. These keywords have to be looked at with greater detail.
The identified keywords are: Breath, Chills, Diarrhea, Flu, Hospitalized, Pains, Pneumonia, Sick, Vomit
Upon closer inspection, many of the microblog messages are actually reporting on loved ones suffering from the symptoms, and may not truly reflect the true number of infected patients. Using JMP Pro 13.0 to filter out records with said keywords on a day-to-day basis, and then sub-filtering them with commonalities between the text. Messages that were more accurate in determining the true number of patients were manually filtered out.
Filtering Out Symptom Reports From Non-infected People
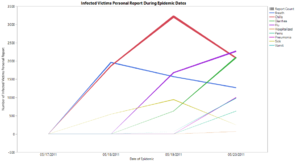
To find actual reports written by the victims, the filtering keywords for each symptom keyword are listed in the below table. Some of the keywords do not have any reports from loved ones, and mostly consist of personal reports, these have been denoted as '<NIL>'. The number of true accounts reflect clearer on how the symptoms are visualized.
Symptoms such as Breath (signifying breathing issues), Chills, Sick show a downward trend, indicating that these identified symptoms are decreasing. The term "Hospitalized" is too general, and with a count of only 68 records, has been dismissed as a useful variable in the analysis. The terms "Diarrhea", "Flu", "Pains", "Pneumonia", and "Vomit" still have a significant upward increase so additional assistance may be required to handle these symptoms. Looking at these keywords, they might be all linked to the gastrointestinal-related symptoms category that is transmitted via the waterborne transmission method. Figure 13 also shows these data trends via a line chart.
| Keyword | Filter Keywords | 05/17/2011 | 05/18/2011 | 05/19/2011 | 05/20/2011 | Self-Reported (Y/N) |
|---|---|---|---|---|---|---|
| Breath | is having | 0 | 1961 | 1571 | 1268 | Y |
| Breath | is having | 0 | 0 | 0 | 520 | N |
| Chills | has come; has caught | 0 | 1865 | 3218 | 2081 | Y |
| Chills | has come; has caught | 0 | 0 | 900 | 2366 | N |
| Flu | has come; has caught | 0 | 0 | 1680 | 2269 | Y |
| Flu | has come; has caught | 0 | 0 | 896 | 1645 | N |
| Hospitalized | is hospitalized | 0 | 0 | 0 | 68 | Y |
| Hospitalized | is hospitalized | 0 | 0 | 0 | 493 | N |
| Pneumonia | has come; has caught; has a | 0 | 0 | 0 | 1002 | Y |
| Pneumonia | has come; has caught; has a | 0 | 0 | 0 | 2674 | N |
| Sick | is sick; declining health; is [only on 05/20/2011] | 0 | 543 | 943 | 248 | Y |
| Sick | is sick; declining health; is [only on 05/20/2011] | 0 | 352 | 634 | 1969 | N |
| Diarrhea | <NIL> | 0 | 0 | 628 | 2099 | Y |
| Diarrhea | <NIL> | 0 | 0 | 0 | 0 | N |
| Pains | <NIL> | 0 | 0 | 1 | 629 | Y |
| Pains | <NIL> | 0 | 0 | 0 | 0 | N |
| Vomit | <NIL> | 1 | 0 | 64 | 983 | Y |
| Vomit | <NIL> | 0 | 0 | 0 | 0 | N |
Airborne Transmission
By 05/20/11, most respiratory-related symptoms are on the downward trend, the truck accident debris should be cleared and the wind should have blown away the contaminated fumes. The source of the respiratory-related epidemic should have been dealt with, and the outbreak should be contained. This is evident in the number of decreasing reports on respiratory-related symptoms by end of 05/20/2011. (Figure 12)
Waterborne Transmission
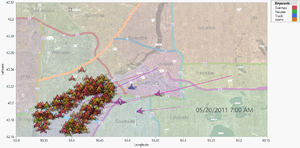
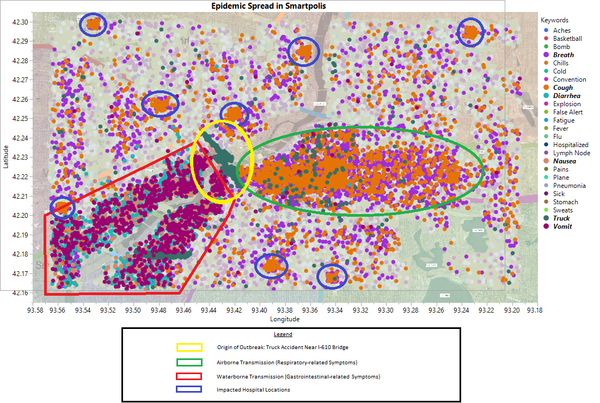
Although the data showed symptoms of the waterborne transmission outbreak are on the rise, further inspection on the scatter plot showed that the location of the microblogs are mostly stagnant around the lower regions of the Vast River (A re-look at the previous Figure 9). There are no signs that the disease has spread beyond this region. Furthermore, the number of infected are mostly in Plainville and Westside areas, each with a density population of 208,333 and 148,810 respectively. The number of infected is considered very low relatively and do not pose any significant threat as long as there are proper control measures in place to prevent further contamination.
Taking into account the downward trends of the symptoms as well as filtering out reports done by other people and not by the actual victims, both of the outbreaks look to be contained and do not need any additional resources to contain them.
Resource Deployment
Emergency management personnel should be deployed to the various hospitals located around Smartpolis. In particular, the following hospitals are more heavily affected by the outbreak and needs additional help:
- Corner Hospital
- Westside Hospital
- Villa Hospital
- Plainville Hospital
- St. Mark's Hospital
- River Hospital
- Lakeside Hospital
- Southville Hospital
Sufficient measures should be taken to warn people about the water contamination in Vast River. The river should be closed to the public and proper cleaning measures taken to decontaminate the vicinity. Drinking water should also be supplied from other sources instead of the Vast River in the meantime.
Since both identified epidemics are likely to be contained after 05/20/11, there should not be any need to deploy any additional emergency management personnel elsewhere besides the hospitals and the affected areas (Figure 1).
Conclusion
- Origin of the outbreak is on I-610 bridge, caused by a truck accident.
- Respiratory epidemic caused by truck fire fumes blown westward towards Downtown area by the westward winds.
- Gastrointestinal epidemic caused by truck cargo spillage traveled south-westwards via Vast River, developing an outbreak near river banks.
- Both epidemics have been contained and do not need additional personnel besides hospitals and affected areas.


