Difference between revisions of "ISSS608 2017-18 T1 Assign Fam Guo Teng"
| Line 25: | Line 25: | ||
|} | |} | ||
<br/> | <br/> | ||
| + | |||
| + | |||
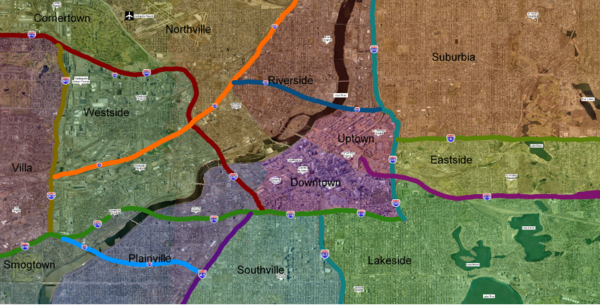
[[Image:Background_Scaled.png|thumb|600px|center|Map of Smartpolis]] | [[Image:Background_Scaled.png|thumb|600px|center|Map of Smartpolis]] | ||
== Background == | == Background == | ||
Revision as of 16:45, 13 October 2017
|
|
|
|
|
|
Contents
Background
Smartpolis is a major metropolitan area with a population of approximately two million residents. During the last few days, health professionals at local hospitals have noticed a dramatic increase in reported illnesses.
Observed symptoms are largely flulike and include fever, chills,sweats, aches and pains, fatigue, coughing, breathing difficulty, nausea and vomiting, diarrhea, and enlarged lymph nodes. More recently, there have been several deaths believed to be associated with the current outbreak. City officials fear a possible epidemic and are mobilizing emergency management resources to mitigate the impact. I have been charged with providing an assessment of the situation.
Two datasets have been provided. The first one contains microblog messages collected from various devices with GPS capabilities. These devices include laptop computers, handheld computers, and cellular phones. The second one contains map information for the entire metropolitan area. The map dataset contains a satellite image with labeled highways, hospitals, important landmarks, and water bodies. Supplemental tables for population statistics and observed weather data have also been provided, along with any additional information.
Locations
<Coming Soon>
Notable Events
<Coming Soon>
Link to Web-based Interactive Data Visualization System
<Coming Soon>

