Difference between revisions of "Outbreak&Affected Areas"
Ziwenhe.2016 (talk | contribs) |
Ziwenhe.2016 (talk | contribs) |
||
| (7 intermediate revisions by the same user not shown) | |||
| Line 1: | Line 1: | ||
<div style=background:#2B3856 border:#A3BFB1> | <div style=background:#2B3856 border:#A3BFB1> | ||
| − | [[Image: | + | [[Image:ZW AffectedAreas.JPG|250px]] |
<font size = 5; color="#FFFFFF">ISSS608 Visual Analytics and Applications Assignment</font> | <font size = 5; color="#FFFFFF">ISSS608 Visual Analytics and Applications Assignment</font> | ||
</div> | </div> | ||
| Line 29: | Line 29: | ||
=Overview= | =Overview= | ||
The key words increased very fast from 17th May to 18th May. The following Bar Chart displayed the number of key words trend. In contrast, the key words sweats trend was interested, it first increased fast and then decreased much. | The key words increased very fast from 17th May to 18th May. The following Bar Chart displayed the number of key words trend. In contrast, the key words sweats trend was interested, it first increased fast and then decreased much. | ||
| − | <gallery heights=" | + | <gallery heights="480" widths="900"> |
File:ZW TrendOfKey.JPG|Figure 0: Trend of Key Words | File:ZW TrendOfKey.JPG|Figure 0: Trend of Key Words | ||
</gallery> | </gallery> | ||
In a word, the outbreak area is in downtown area. And then spread to other regions. For more information, please refer to the visualizing part. | In a word, the outbreak area is in downtown area. And then spread to other regions. For more information, please refer to the visualizing part. | ||
| − | = | + | =Visualization= |
By watching all the scatterplots trend in the Map, found firstly that the outbreak was happened in the downtown area. And then spread to different regions. | By watching all the scatterplots trend in the Map, found firstly that the outbreak was happened in the downtown area. And then spread to different regions. | ||
| − | For the different | + | For the different key words, the scatterplots trend in the Map could divided into three types. One is infectious-related symptoms, such as fever, flu, cough. One is none infectious related symptoms, like headache and Fatigue. The last one is intestines and stomach symptoms, such as nausea and diarrhea. |
The following screenshot(Figure 1) displayed the location of all the affected areas. After tracking the scatterplots for the different key words via date, the trends of key words of fever, flu, cough, pain, sick, breath, chill are almost the same. It first happened in the downtown area in 18th May and then spread quickly to the other regions in the next two days. | The following screenshot(Figure 1) displayed the location of all the affected areas. After tracking the scatterplots for the different key words via date, the trends of key words of fever, flu, cough, pain, sick, breath, chill are almost the same. It first happened in the downtown area in 18th May and then spread quickly to the other regions in the next two days. | ||
| − | <gallery heights="500" widths=" | + | <gallery heights="500" widths="850"> |
File:ZW AffectedAreas.JPG|Figure 1: Affected Areas | File:ZW AffectedAreas.JPG|Figure 1: Affected Areas | ||
</gallery> | </gallery> | ||
| Line 54: | Line 54: | ||
*''17th May truck accident in Bridge 610'' | *''17th May truck accident in Bridge 610'' | ||
| + | =Tableau Final Outputs URL= | ||
| + | The following link is the final output of the visualization. | ||
| − | + | https://public.tableau.com/profile/ziwen7290#!/vizhome/Assignment_240/Map?publish=yes | |
| − | |||
Latest revision as of 20:39, 15 October 2017
 ISSS608 Visual Analytics and Applications Assignment
|
|
|
|
|
|
Overview
The key words increased very fast from 17th May to 18th May. The following Bar Chart displayed the number of key words trend. In contrast, the key words sweats trend was interested, it first increased fast and then decreased much.
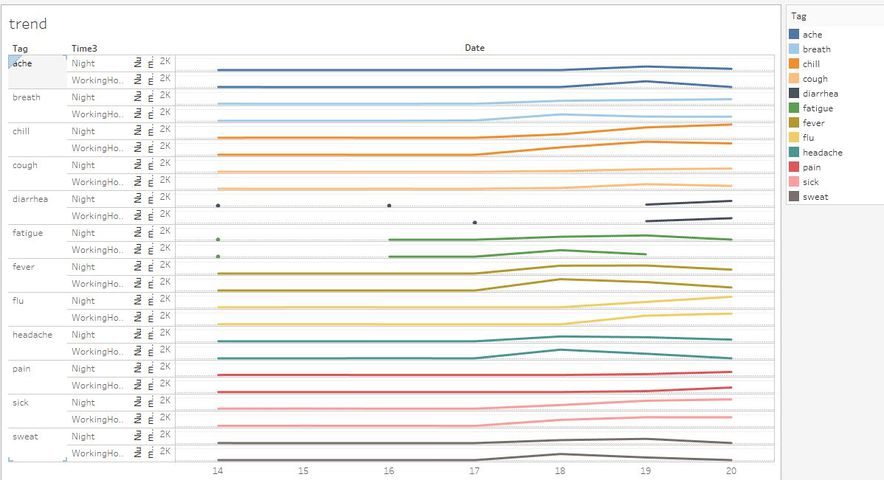
Figure 0: Trend of Key Words

In a word, the outbreak area is in downtown area. And then spread to other regions. For more information, please refer to the visualizing part.
Visualization
By watching all the scatterplots trend in the Map, found firstly that the outbreak was happened in the downtown area. And then spread to different regions. For the different key words, the scatterplots trend in the Map could divided into three types. One is infectious-related symptoms, such as fever, flu, cough. One is none infectious related symptoms, like headache and Fatigue. The last one is intestines and stomach symptoms, such as nausea and diarrhea.
The following screenshot(Figure 1) displayed the location of all the affected areas. After tracking the scatterplots for the different key words via date, the trends of key words of fever, flu, cough, pain, sick, breath, chill are almost the same. It first happened in the downtown area in 18th May and then spread quickly to the other regions in the next two days.
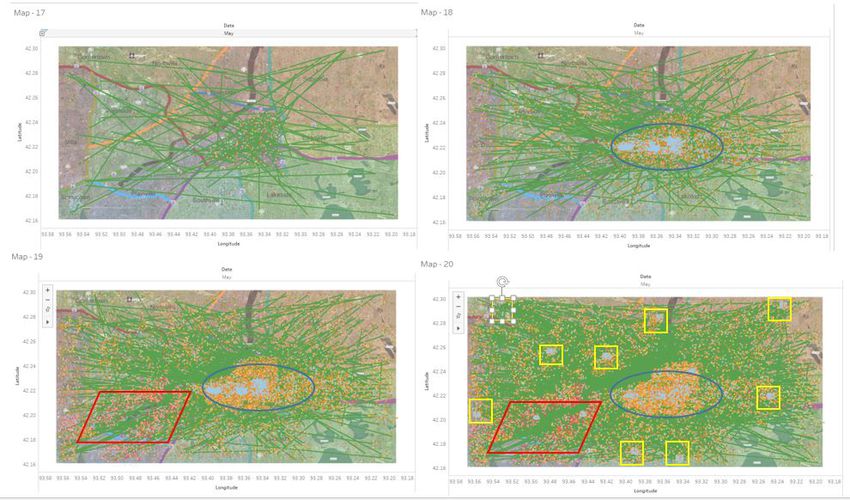
Figure 1: Affected Areas
The Figure 1 shows all the affected areas in the whole regions. Firstly, it happened in the downtown area marked in blue ellipse in Figure 1 on 18th May. Secondly, on 19th May, it spread to other regions widely but the areas were not concentrated. Last, on 20th May, it spread to the several centralized areas which marked in yellow square in Figure 1.
According to the founding above, before 18th May there should be something happened. By seaching the texts during 17th May, a truck accident happened in the Bridge 610 which is mentioned many times in the text. Figure 2 displays the number of key words truck accident mentioned in the comments. And Figure 3 displays the place which the accident happened.
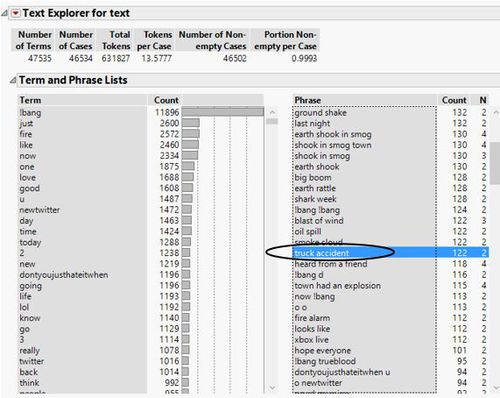
Figure 2: Text Analyse 17th
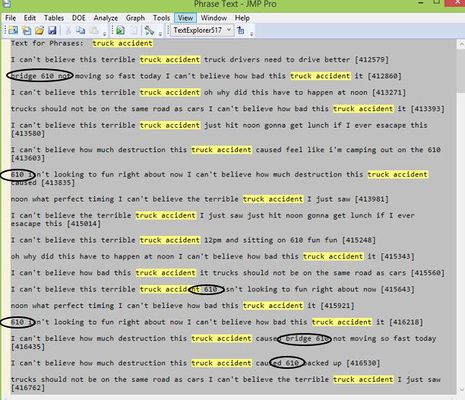
Figure 3: Accident Place in the comments


There are also many different events during the 30 days. The major two events found in the comments list in 17th May as below.
- 17th May explosion in Smog Town
- 17th May truck accident in Bridge 610
Tableau Final Outputs URL
The following link is the final output of the visualization.
https://public.tableau.com/profile/ziwen7290#!/vizhome/Assignment_240/Map?publish=yes