IS428 2017-18 T1 Assign Lucas Leong Li Heng
Contents
Links
The Task
General Task
The four factories in the industrial area are subjected to higher-than-usual environmental assessment, due to their proximity to both the city and the preserve. Gaseous effluent data from several sampling stations has been collected over several months, along with meteorological data (wind speed and direction), that could help Mitch understand what impact these factories may be having on the Rose-Crested Blue Pipit. These factories are supposed to be quite compliant with recent years’ environmental regulations, but Mitch has his doubts that the actual data has been closely reviewed. Could visual analytics help him understand the real situation?
The primary job for Mitch is to determine which (if any) of the factories may be contributing to the problems of the Rose-crested Blue Pipit. Often, air sampling analysis deals with a single chemical being emitted by a single factory. In this case, though, there are four factories, potentially each emitting four chemicals, being monitored by nine different sensors. Further, some chemicals being emitted are more hazardous than others. Your task, as supported by visual analytics that you apply, is to detangle the data to help Mitch determine where problems may be. Use visual analytics to analyze the available data and develop responses to the questions below.
The Specific Tasks
- Characterize the sensors’ performance and operation. Are they all working properly at all times? Can you detect any unexpected behaviors of the sensors through analyzing the readings they capture?Limit your response to no more than 9 images and 1000 words.
- Now turn your attention to the chemicals themselves. Which chemicals are being detected by the sensor group? What patterns of chemical releases do you see, as being reported in the data? Limit your response to no more than 6 images and 500 words.
- Which factories are responsible for which chemical releases? Carefully describe how you determined this using all the data you have available. For the factories you identified, describe any observed patterns of operation revealed in the data. Limit your response to no more than 8 images and 1000 words.
Data Preparation
Location Data
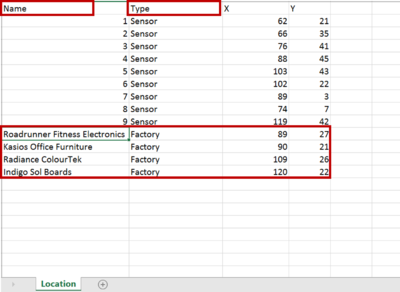
The location of the factories is not stored within any of the data sheets given. We will append the coordinates of the factories locations into the file "Sensor Location". A new column is added called "Type" which classifies the records into either "Sensor" or "Factory. The column name "Monitor" is changed to "Name". The output is as shown below.
Meteorological Data
In this file, there is a column called "Elevation". We will remove it since it does not contribute to the visualisation process. In row 445, at time 8/30/16 3:00, Wind Direction and Wind Speed values are missing. A value of 0 is assumed and added into the row. In row 460, there is a blank row. This entire row is removed to facilitate the data import process into Tableau.

