IS428 2017-18 T1 Assign Tan Zhi Chong
Contents
Problem and Motivation
Mistford is a mid-size city is located to the southwest of a large nature preserve. The city has a small industrial area with four light-manufacturing endeavors. Mitch Vogel, a post-doc student studying ornithology at Mistford College, has found evidence suggesting that the number of nesting pairs of the Rose-Crested Blue Pipit, a popular local bird due to its attractive feathers and pleasant songs, is decreasing. The Pangera Ornithology Conservation Society is sponsoring Mitch on a research to uncover the possible causes of the decrease in the population of the Rose-Crested Blue Pit.
With access to the following data:
- Sensor Data – Hourly readings of the chemical levels detected by the 9 monitors
- Meteorological Data – Wind Direction and Wind speed collected on 3 hours intervals
- Monitor Data – X and Y Coordinates of the 9 monitors
, Mitch has sought out help in analysing these datasets to find out the possible reasons for the drop in Rose-Crested Blue Pits.
Dataset Cleaning Process
Issue 1: Lack of Factories Coordinates
Issue:
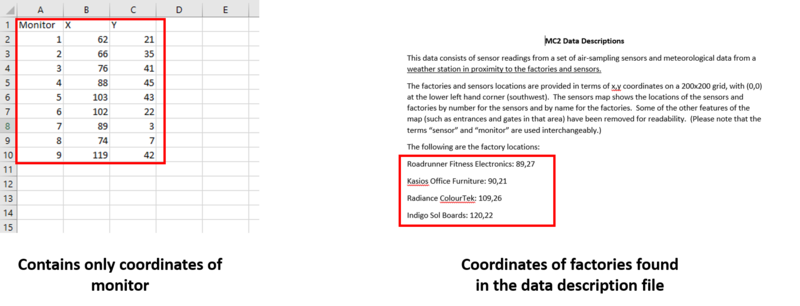
- There is only one location data provided, which shows the x and y coordinates of the 9 monitors. The data does not contain the coordinates of the factories.
- Luckily, the coordinates of the factories can be found inside the data description file.
Solution:
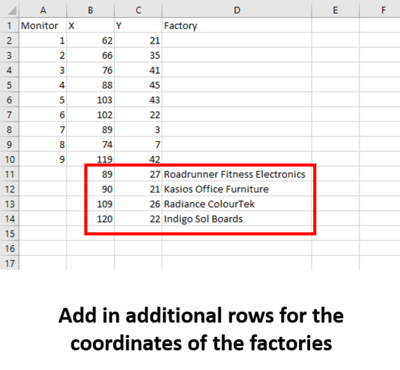
- Insert the coordinates of the factories into our location data.
- Save the file separately as “Location Data”
Issue 2: Extra Elevation Column
Issue:
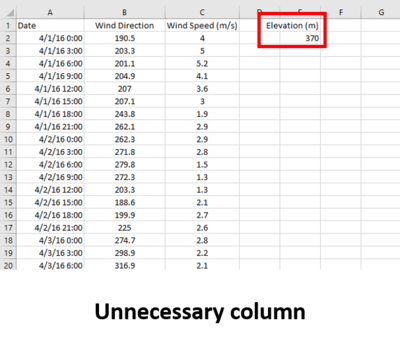
- There is an additional Elevation Column in the “Meteorological Data”.
- It might be useful if a a topographical map of the region is provided but since the only height that is provided out of all the data is the elevation, it will be difficult to make use of it
Solution:
- The elevation column will be removed since it does not add value to our analysis.
- Delete the elevation column and save the file as “Meteorological Data Cleaned”.
Issue 3: Challenge in Mapping Hours
Issue:
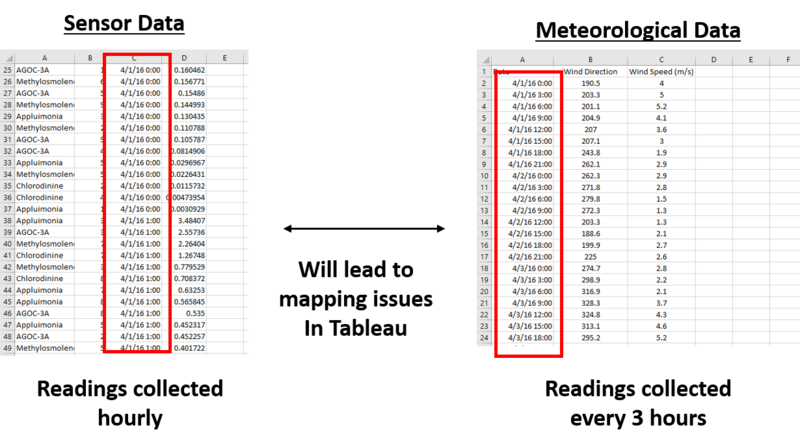
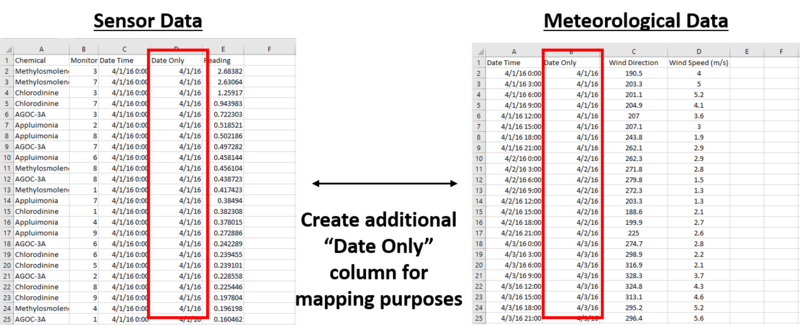
- The Sensor Data is collected hourly while the Meteorological Data is collected every 3 hours. This makes it difficult to map the Date Time columns of both data source because for every 3 hours, 2 hours will not be mapped from the Sensor Data to the Meteorological Data
Solution:
- We will map the values by date instead of date and time. This will ensure that all values will be mapped across.
- Create a separate “Date Only” column in both the Meteorological Data and Sensor Data.
- This can be easily done by copying the values from the Date Time column over to a new column, then change the format of the column to “Short Date”
- Save the edited Sensor Data and Meteorological Data as Sensor Data Cleaned and Meteorological Data Cleaned respectively.
Dataset Import Structure & Preparation Process
Once data cleaning is completed, we will import the following data files into Tableau for analysis
1. Import Data
- Import the 3 data into Tableau each as a separate data source
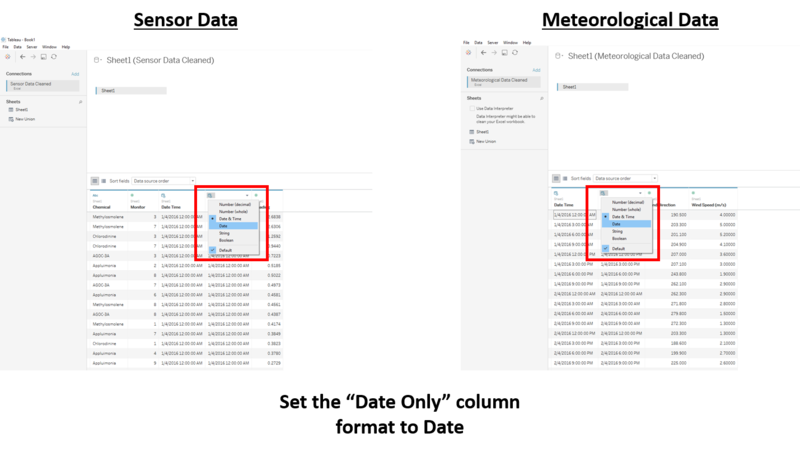
2. Change Columns to Right Format
- Ensure that the “Date Only” column is set to Date type
3. Data Blending
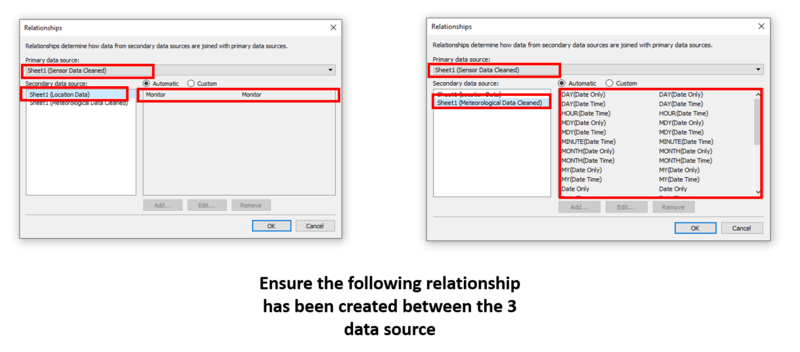
- Click on Data > Edit Relationship to edit the relationship between the data source
- Set Sensor Data as the primary data source
- Create a relationship between the Sensor Data and Location Data with the Monitor dimension. Tableau can map it automatically
- Create a relationship between the Sensor Data and Meteorological Data with the Date dimension. Tableau can map it automatically.
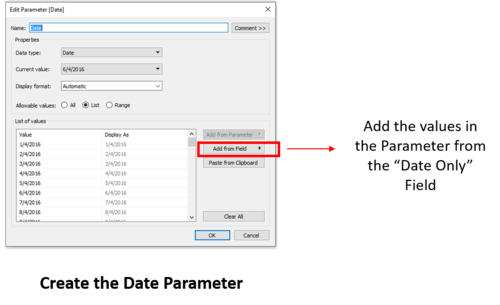
4. Create Parameters
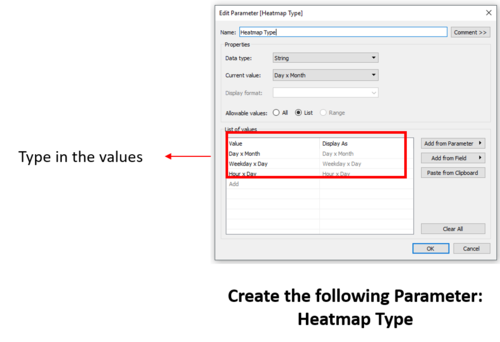
- Create the Date parameter for changing the dates on the dashboard later
- Create the Heatmap Type parameter for sheet swapping capabilities on the dashboard
5. Create Calculated Fields
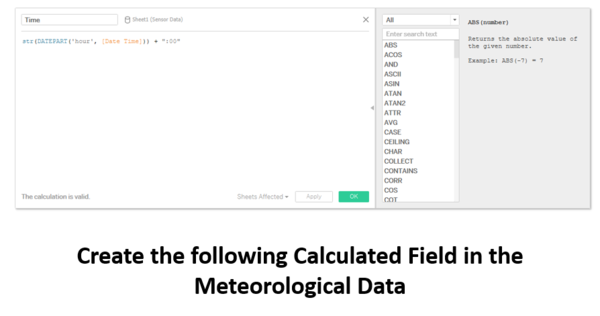
- a. Create the “Time” calculated field with the following formula
str(DATEPART('hour', [Date Time])) + ":00"
- This is done so that our time time will appear as “12:00” instead of “12”.
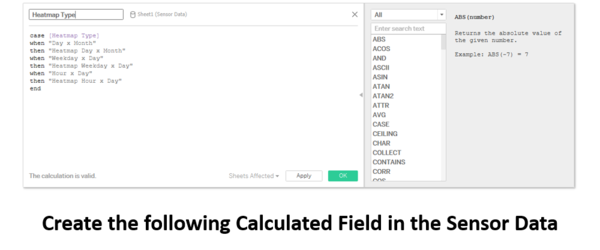
- b. Create the Heatmap Type calculated field for the sheet swapping capabilities between the different heatmaps on the dashboard
 case [Heatmap Type]
 when "Day x Month"
 then "Heatmap Day x Month"
 when "Weekday x Day"
 then "Heatmap Weekday x Day"
 when "Hour x Day"
 then "Heatmap Hour x Day"
 end
- “Heatmap Day x Month” refers to the name of my worksheet
6. Import Image as Background Map
- Select Map > Background images > Location Data
- Click on Add image
- Browse to open the image file of the map
- Map the X field to X and Y field to Y
- Set the left and right to 0 and 200 respectively
- Set the bottom and top to 0 and 200 respectively
- Click on the options and select "Lock Aspect Ratio" and "Always Show Entire Image"
