Visual Autolytic: Application

From Visual Analytics for Business Intelligence
Revision as of 03:55, 26 November 2017 by Kangli.low.2014 (talk | contribs) (Created page with "<div style="background:#006768; padding: 15px; font-weight: bold; line-height: 0.3em; text-indent: 15px; font-size: 20px;margin-top:25px"><font color=#FFFFFF>Web Application</...")
(diff) ← Older revision | Latest revision (diff) | Newer revision → (diff)
Jump to navigation Jump to search
Web Application
Related page

Home Page: One Timeline to unite Us All

Homepage.png


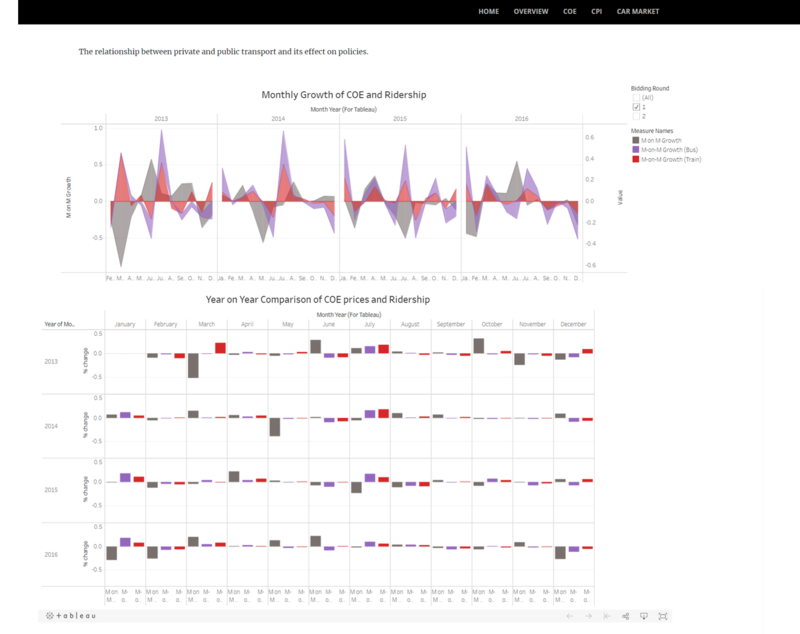
Overview: The relationship between public and private transport ad effects of policies

Overview.png

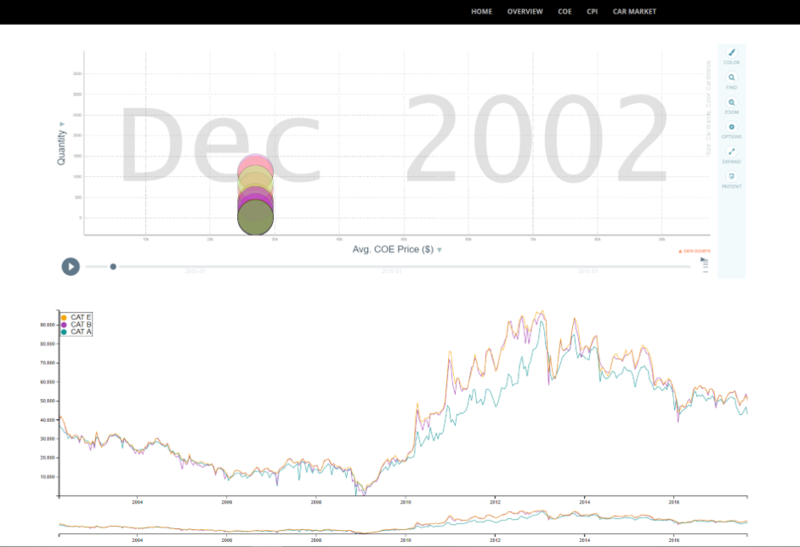
COE: The relationship between COE prices and Demand Quantities

Coe.png

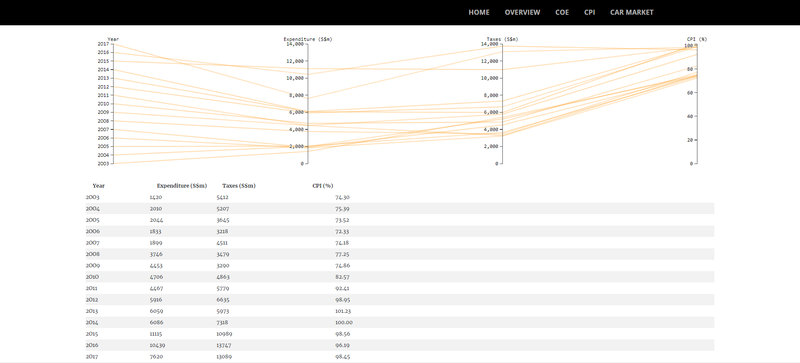
CPI: An Overview of government's expenditure on transport system as a proportion of transport tax in the form of COE

Cpi.png

Car Market: Overall Cars Market Share in Singapore

Treemapfinal.png

The user can see the following car brands once they click on any countries show in the treemap.

Treemapfinalcarbrands.png

Car Market: Cars Market Share By Countries

Slopegraph1.png

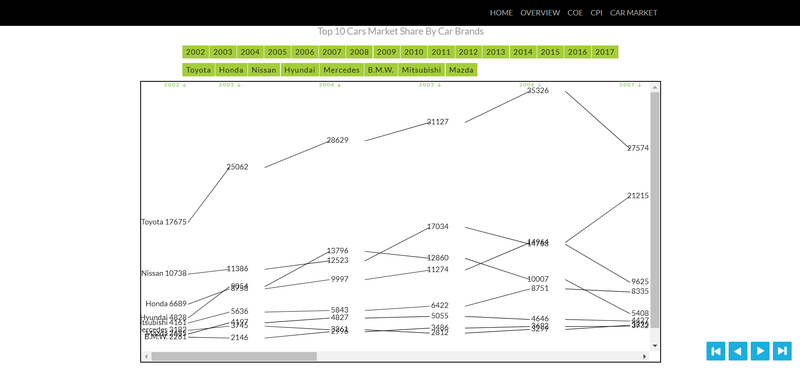
Car Market: Top 10 Cars Market Share By Car Brands

Slopegraph2.png