Visual Autolytic: Application

From Visual Analytics for Business Intelligence
Jump to navigation Jump to search
Logo.jpg

Proposal


Project Application


Research Paper


Poster

Web Application

Click HERE to download our project "This is our FULL user guide" : User Guide

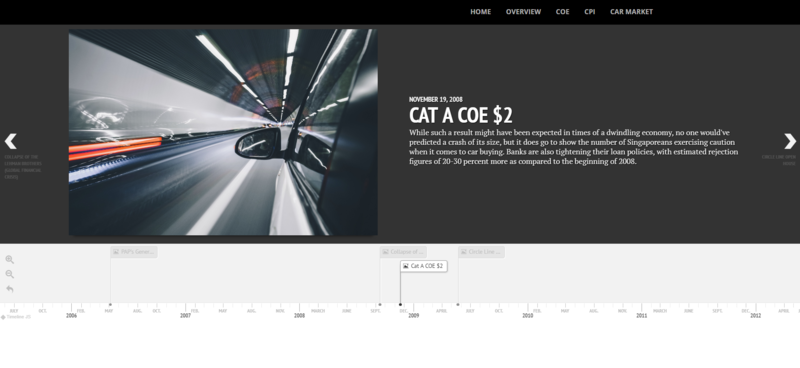
Home Page: One Timeline to unite Us All

Homepage1.PNG


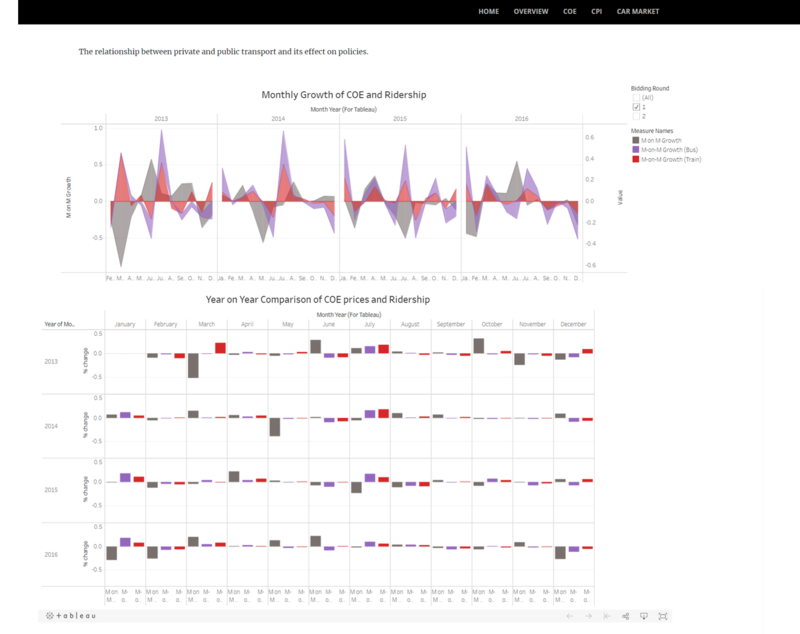
Overview: The relationship between public and private transport and effects of policies

Overview.png

COE: The relationship between COE prices and Demand Quantities

Coe1.png

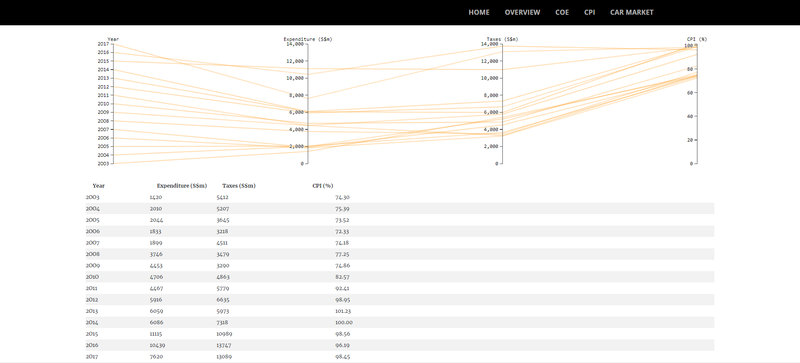
CPI: An Overview of government's expenditure on transport system as a proportion of transport tax in the form of COE

Cpi.png

Car Market: Overall Cars Market Share in Singapore

Treemapfinal.png

The user can see the following car brands once they click on any countries show in the treemap.

Treemapfinalcarbrands.png

Car Market: Cars Market Share By Countries

Slopegraph1.png

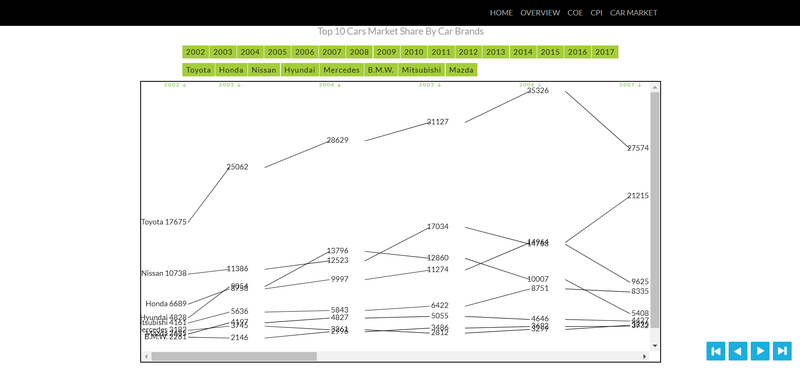
Car Market: Top 10 Cars Market Share By Car Brands

Slopegraph2.png