1718t1is428T11
Contents
Introduction
According to Forbes, the automobile industry has grown by a massive 68% since hitting a trough during the 2009 global financial crises according to a report published by car auction company Manheim earlier this year.
Q3 2016 closed with 9.8M vehicles sold in the used car market -an increase of 3.3% over the previous year. Also the average retail used vehicle sold for $19.232 in Q3 2016, an increase of 4.3% over last year. Changes in car buying behavior are beginning to alter the landscape of franchised used vehicles.
So both franchised used car firms and other giant online marketplaces like E-Bay are leveraging the growth rate of used car industy. As a result, we tried to understand this market and its dynamics with the help of ‘Used Car Database’ from E-Bay.
Problem and Motivation
With the change in consumer car buying behaviour and a rising market for used cars, our aim is to understand this growing used car market. When consumers look at used cars, price is the most important factor that influences opinions, but there are also few other facts that affect their purchasing decision. So we will try to find out which variables affect the price most and how they are correlated.
Objective
In this project, we are interested to create a visualisation application that helps users perform the following:
1. Visualise resale car prices against other factors such as:
- Type of cars
- Car Brands
- Car age
- Kilometers traveled
- Time period
- Location/ state
2. Identify relationships and correlations across different factors affecting resale prices
3. Uncover the top 10 most common brands for car resale
- Difference in prices & quantity sold across different brands
Data
Data used is obtained from Kaggle website and it is about used cars in Ebay Kleinanzeigen. This dataset contains 371539 records and consists of following columns.
| Attribute | Description |
|---|---|
| dateCrawled | when this ad was first crawled, all field-values are taken from this date |
| name | "name" of the car |
| seller | private or dealer |
| fuelType | "name" of the car |
| price | the price on the ad to sell the car |
| vehicleType | vehicle type |
| yearOfRegistration | at which year the car was first registered |
| gearbox | gearbox |
| brand | brand of the car |
| notRepairedDamage | if the car has a damage which is not repaired yet |
| dateCreated | the date for which the ad at ebay was created |
| nrOfPictures | number of pictures in the ad |
| lastSeenOnline | when the crawler saw this ad last online |
| powerPS | power of the car in PS |
| km | how many kilometers the car has driven |
| model | car model |
| monthOfRegistration | at which month the car was first registered |
| postalCode | postal code |
| offerType | / |
| abtest | / |
Research Visualisation
| Visualizations | Explaination |
|---|---|
|
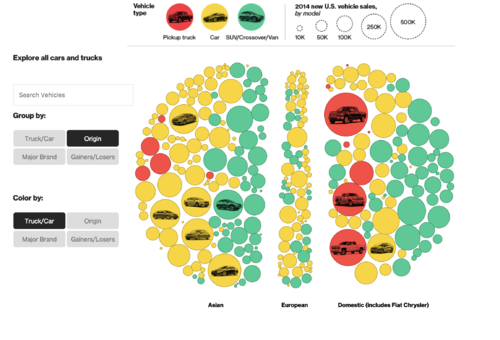
Bubble Chart
| |
|
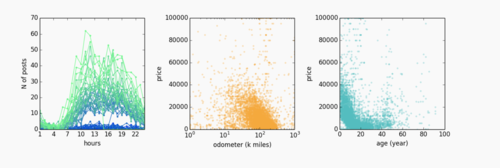
Scatter Plot
| |
|
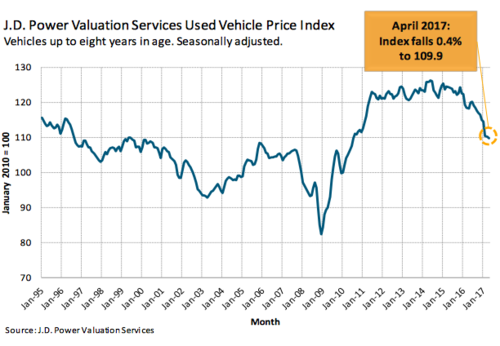
Line Graph
|
Tools
-Excel
-D3
-Javascript
-Github
-Tableau
Technical Challenges
| Technical Challenges | Action Plan |
|---|---|
| |
| |
|
Roles & Milestones
- Project Roles
Dong Ruiyan: Visualisation Analyst
Zhang Qian: Visualisation Designer
Jeremy LEE Ting Kok: Project Manager
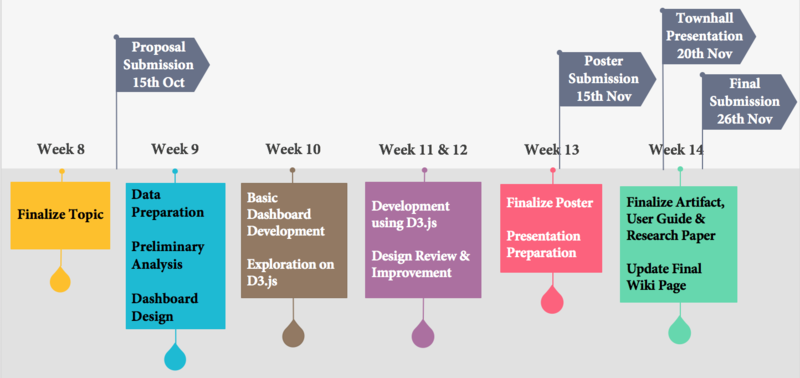
- Project Timeline
References
- Bloomberg - Scientific Proof that Americans are Completely Addicted to Trucks: https://www.bloomberg.com/graphics/2015-auto-sales/
- Predict second hand car price using artificial neural network: http://csidsocialmedia.github.io/2014/05/02/Predict-second-hand-car-price-using-artificial-neural-network.html
- The Perfect Storm Hits Used-Car Values: The Foundation Of The Auto Industry Is Faltering: http://www.zerohedge.com/news/2017-05-21/perfect-storm-hits-used-car-values-foundation-auto-industry-faltering
- Kaggle - Used car database: https://www.kaggle.com/orgesleka/used-cars-database
- Kaggle - Data Crunchers: https://www.kaggle.com/timucinanuslu/data-crunchers
- D3.js: https://d3js.org/
- Chart.js: http://www.chartjs.org/
