1718t1is428T10
Editing 1718t1is428T11 WikitextPreviewChangesPublishCancel BoldItalicSignature and timestampLinkEmbedded fileReferenceAdvancedSpecial charactersHelp HeadingFormatBulleted listNumbered listNo wiki formattingNew lineBigSmallSuperscriptSubscriptInsertPicture galleryRedirectTableSearch and replace
Contents
Introduction
testing
Problem and Motivation
testing
Objective
testing
Data
testing
Research Visualisation
| Visualizations | Explaination |
|---|---|
|
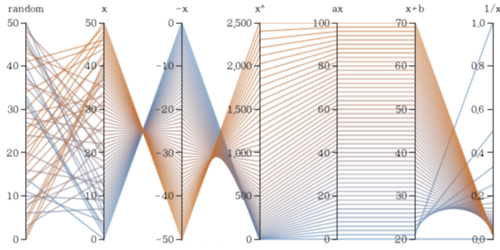
Parallel Coordinates
| |
|
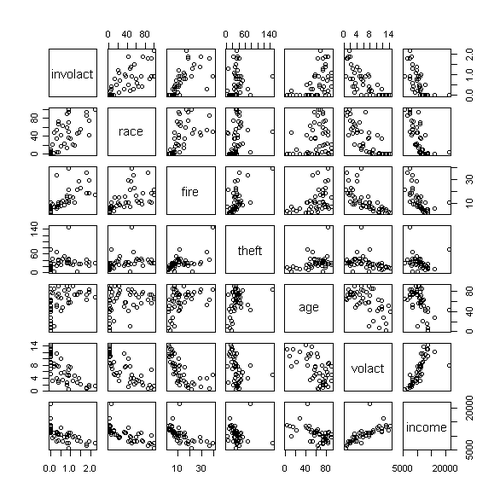
Scatter Plot
| |
|
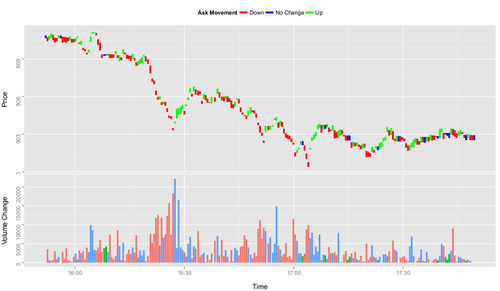
Stock price movement
|
Tools
-Excel
-D3
-Javascript
-Github
-Tableau
Technical Challenges
| Technical Challenges | Action Plan |
|---|---|
| |
| |
|
Roles & Milestones
- Project Roles
Dong Ruiyan: Visualisation Analyst
Zhang Qian: Visualisation Designer
Jeremy LEE Ting Kok: Project Manager
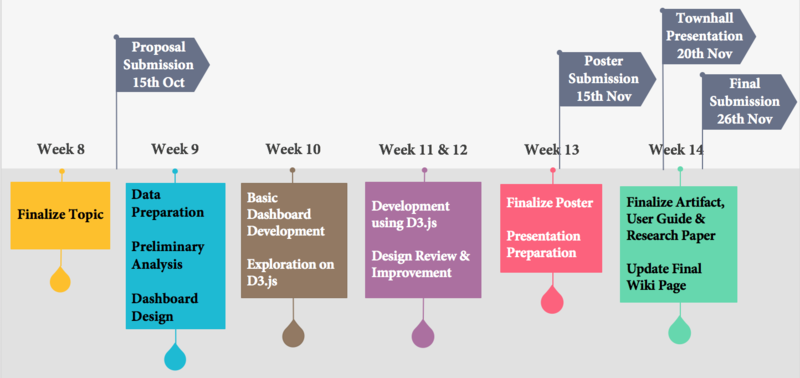
- Project Timeline
References
- Boss Bidding: https://oasis.smu.edu.sg/Pages/RO/All-About-BOSS.aspx
- Parallel Coordinates: https://bl.ocks.org/jasondavies/1341281
- Simple Scatter Chart Example: http://bl.ocks.org/bunkat/2595950
- Stock Price: http://active-analytics.com/blog/plottinglivechartswithyahoofinancedataandggplot2inr/
- D3.js: https://d3js.org/
- Chart.js: http://www.chartjs.org/
Summary:
This is a minor edit Watch this page
Please note that all contributions to Visual Analytics for Business Intelligence may be edited, altered, or removed by other contributors. If you do not want your writing to be edited mercilessly, then do not submit it here. You are also promising us that you wrote this yourself, or copied it from a public domain or similar free resource (see Visual Analytics for Business Intelligence:Copyrights for details). Do not submit copyrighted work without permission! Save page Show preview Show changes Cancel Navigation menu Victor.tang.2015TalkPreferencesWatchlistContributionsLog outPageDiscussionReadEditView historyWatch
Search Go Main Page Course information Project Groups Recent changes Terms of use Wiki Policy Intellectual Property Help Tools What links here Related changes Upload file Special pages Page information Privacy policyAbout Visual Analytics for Business IntelligenceDisclaimersPowered by MediaWiki


