IS428 2017-18 T1 Assign Mark Ng Wei Jie
Contents
Links
Overview
Mistford is a mid-size city is located to the southwest of a large nature preserve. The city has a small industrial area with four light-manufacturing endeavors. Mitch Vogel is a post-doc student studying ornithology at Mistford College and has been discovering signs that the number of nesting pairs of the Rose-Crested Blue Pipit, a popular local bird due to its attractive plumage and pleasant songs, is decreasing! The decrease is sufficiently significant that the Pangera Ornithology Conservation Society is sponsoring Mitch to undertake additional studies to identify the possible reasons. Mitch is gaining access to several datasets that may help him in his work, and he has asked you (and your colleagues) as experts in visual analytics to help him analyze these datasets.
Mitch Vogel was immediately suspicious of the noxious gases just pouring out of the smokestacks from the four manufacturing factories south of the nature preserve. He was almost certain that all of these companies are contributing to the downfall of the poor Rose-crested Blue Pipit bird. But when he talked to company representatives and workers, they all seem to be nice people and actually pretty respectful of the environment.
In fact, Mitch was surprised to learn that the factories had recently taken steps to make their processes more environmentally friendly, even though it raised their cost of production. Mitch discovered that the state government has been monitoring the gaseous effluents from the factories through a set of sensors, distributed around the factories, and set between the smokestacks, the city of Mistford and the nature preserve. The state has given Mitch access to their air sampler data, meteorological data, and locations map. Mitch is very good in Excel, but he knows that there are better tools for data discovery, and he knows that you are very clever at visual analytics and would be able to help perform an analysis.
The Task
General task
The four factories in the industrial area are subjected to higher-than-usual environmental assessment, due to their proximity to both the city and the preserve. Gaseous effluent data from several sampling stations has been collected over several months, along with meteorological data (wind speed and direction), that could help Mitch understand what impact these factories may be having on the Rose-Crested Blue Pipit. These factories are supposed to be quite compliant with recent years’ environmental regulations, but Mitch has his doubts that the actual data has been closely reviewed. Could visual analytics help him understand the real situation?
The primary job for Mitch is to determine which (if any) of the factories may be contributing to the problems of the Rose-crested Blue Pipit. Often, air sampling analysis deals with a single chemical being emitted by a single factory. In this case, though, there are four factories, potentially each emitting four chemicals, being monitored by nine different sensors. Further, some chemicals being emitted are more hazardous than others. Your task, as supported by visual analytics that you apply, is to detangle the data to help Mitch determine where problems may be. Use visual analytics to analyze the available data and develop responses to the questions below.
The specific tasks
Sensors' Performance and Operation
Characterize the sensors’ performance and operation. Are they all working properly at all times? Can you detect any unexpected behaviors of the sensors through analyzing the readings they capture?Limit your response to no more than 9 images and 1000 words.
Exploratory Data Analysis
Sensor Data.xlsx
To check the data's integrity, we have to have an overview of the readings. I did this by plotting a heat map of the readings of individual days and hours.
From this visualization one can see the presence of the missing values in the white spaces. We can also see that these missing values only appear in the Methylosmolene readings.
Caption1
Caption2

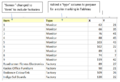
Next I wanted to explore more closely these missing values by looking at the exact count of values occurring in each hour to explore the link between the chemical and the missing values.
Caption1
Caption2
From this heat map, readings showed another unexpected trend of additional values on the readings in the AGOC-3A values.
A closer analysis on the specific sensors' readings it is clear that the missing Methylosmolene readings were the additional AGOC-3A readings.
Caption1
Caption2
Caption1
Caption2
However, on closer analysis of these values, these duplicated AGOC-3A values have little to no correlation to its surrounding values and thus cannot be placed back into a "original" Methylosmolene readings, some of the values were extremely large. The only trend i could get out was that the top were larger than the bottom values. if one was not careful using Excel's remove duplicates only the bottom values would be removed. The adding of these values in could cause issues to the results. Especially if these large values were pure errors.
Overall
Caption1
Caption2
This overview comparison shows how the data with the duplicates removed is much more manageable and understandable by observing the trend of consistent counts as well as the much less volatile readings we are more able to analyse actual trends of real clean data, without the fear of inaccurate readings.
However, a key point to note is that missing data is not visually represented here in these graphs instead they are completely ignored and un represented as those values instead distract from the accurate data.
Meteorological Data
Once again I performed the same analysis by visualizing the data in the form of a heat map to check for missing and or additional data.
Caption1
Caption2
As we can visually see the hour of recordings is different from the chemical sensors as this is in 3 hour intervals, as well as there are missing readings for both wind speed and wind direction from the 1st of August 0000h till the 4th of August till 1800h.
Chemicals
Now turn your attention to the chemicals themselves. Which chemicals are being detected by the sensor group? What patterns of chemical releases do you see, as being reported in the data? Limit your response to no more than 6 images and 500 words.
Analysis of Methylosmolene
As we look at an overview of all the chemicals detected by the sensors from the cleaned data
Caption1
Caption2
We can clearly observe that Methylosmolene readings are the most outstanding with AGOC-3A coming in 2nd having a few minor spikes. Considering both the daily and hourly breakdown the hourly breakdown seemed to provide more detailed data. Also ase we can see the peaks tend to be from the early days to the middle of the months tapering off toward the end of the month. the trend of the tapering off to the ends of the month are more apparent in this summing up of the readings of the days in the month
Caption1
Caption2
Now this would lead me to want to see a deeper breakdown of this trend and it turns out when analysing the Weekday breakdowns we can see a clear trend in Methylosmolene. We can see here that the chemical is detected mostly in the late nights and into the early mornings.
Caption1
Caption2
This would call for an hourly analysis into the Methylosmolene readings and sure enough there is a trend of increased Methylosmolene detected in the late evenings and early mornings..
Caption1
Caption2
Analysis of AGOC-3A
Now for a closer look at AGOC-3A
Caption1
Caption2
Now it turns out that similar to Methylosmolene, AGOC-3A also does show signs of the same trend where early mornings and late nights experience a peak in readings.
Factories
Which factories are responsible for which chemical releases? Carefully describe how you dete
Gary Quek, [06.10.17 16:39] rmined this using all the data you have available. For the factories you identified, describe any observed patterns of operation revealed in the data. Limit your response to no more than 8 images and 1000 words.