Difference between revisions of "Visual Autolytic: Application"

From Visual Analytics for Business Intelligence
Jump to navigation Jump to search
Line 32: Line 32:
 
|  
 
|  
 
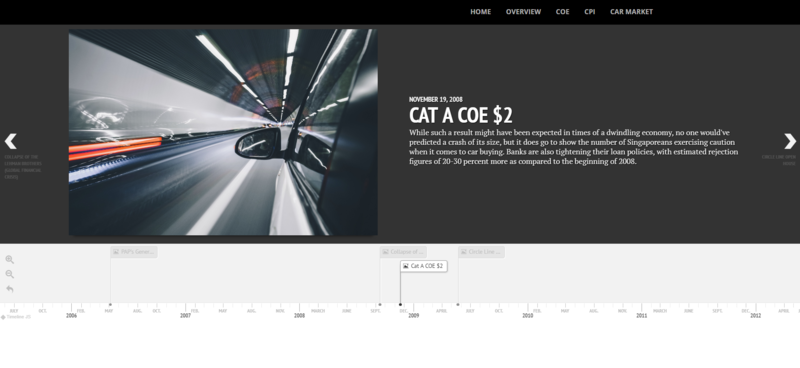
<p><center>''' Home Page: One Timeline to unite Us All ''' </center></p>
 
<p><center>''' Home Page: One Timeline to unite Us All ''' </center></p>
[[File:Homepage.png|center|800px]]
+
[[File:Homepage1.PNG|center|800px]]


Revision as of 21:20, 26 November 2017

Logo.jpg

Proposal


Project Presentation


Project Application


Research Paper


Poster

Web Application

Home Page: One Timeline to unite Us All

Homepage1.PNG


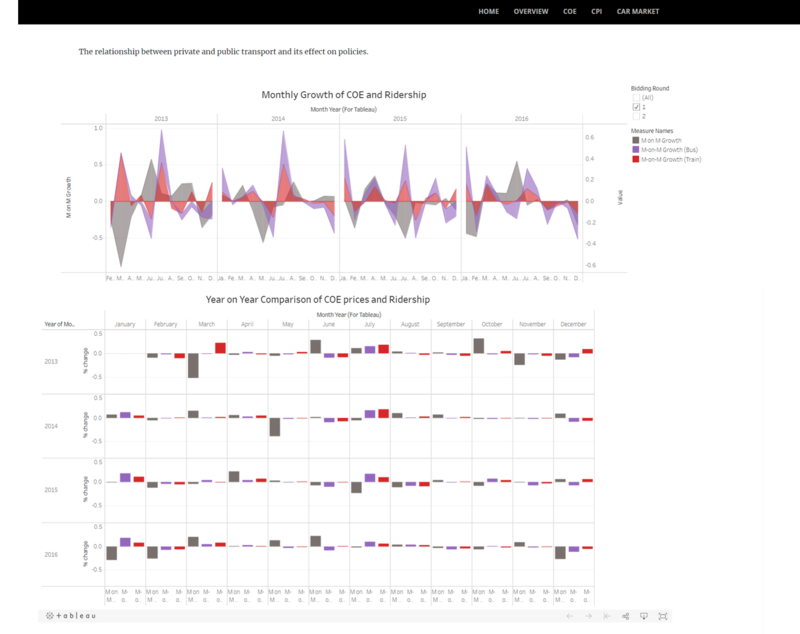
Overview: The relationship between public and private transport and effects of policies

Overview.png

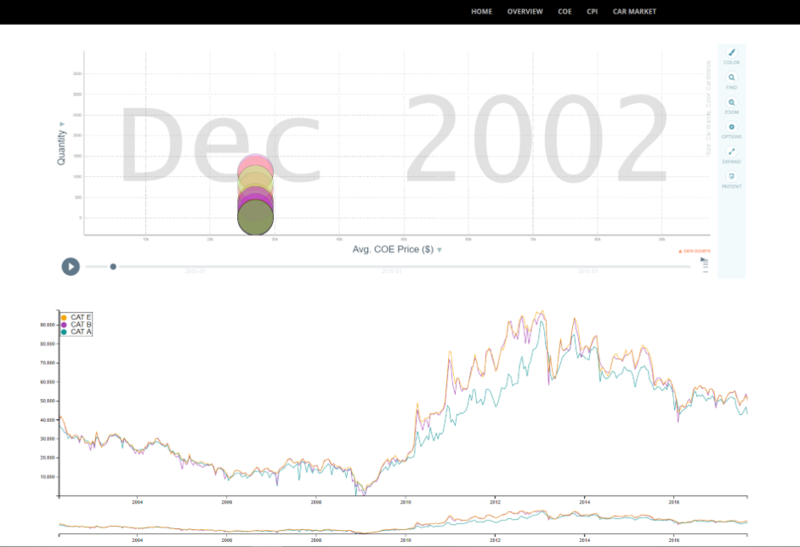
COE: The relationship between COE prices and Demand Quantities

Coe.png

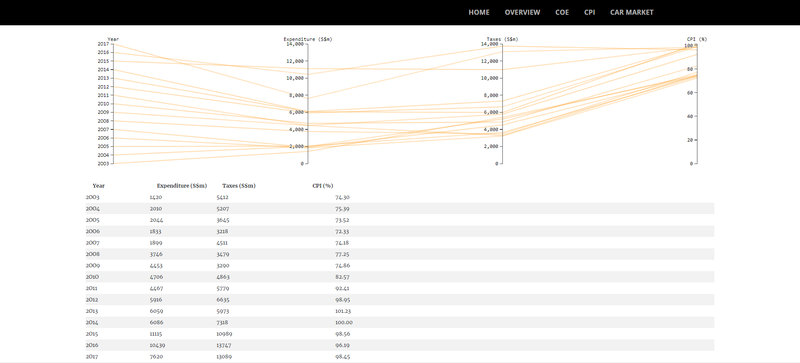
CPI: An Overview of government's expenditure on transport system as a proportion of transport tax in the form of COE

Cpi.png

Car Market: Overall Cars Market Share in Singapore

Treemapfinal.png

The user can see the following car brands once they click on any countries show in the treemap.

Treemapfinalcarbrands.png

Car Market: Cars Market Share By Countries

Slopegraph1.png

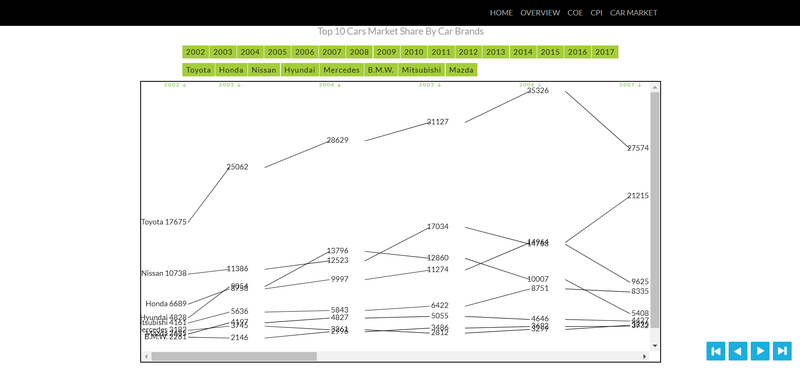
Car Market: Top 10 Cars Market Share By Car Brands

Slopegraph2.png