Difference between revisions of "1718t1is428T11"
| Line 67: | Line 67: | ||
==<div style="background: #07264C; padding: 15px; line-height: 0.3em; text-indent: 15px; font-size:18px; font-family:Garamond"><font color= #FFFFFF>Data</font></div>== | ==<div style="background: #07264C; padding: 15px; line-height: 0.3em; text-indent: 15px; font-size:18px; font-family:Garamond"><font color= #FFFFFF>Data</font></div>== | ||
<div style="font-family:Garamond;font-size:16px"> | <div style="font-family:Garamond;font-size:16px"> | ||
| − | Data used is obtained from | + | Data used is obtained from crawling it off the sgcarmart website (http://www.sgcarmart.com/used_cars/listing.php). Specifically focusing on used cars. |
| + | |||
| + | This dataset contains 28028 records and consists of following columns. <br/> | ||
{| class="wikitable" style="background-color:#ffffff;" width="100%" | {| class="wikitable" style="background-color:#ffffff;" width="100%" | ||
| Line 74: | Line 76: | ||
! style="font-weight: bold;background: #002060;color:#fbfcfd;width: 50%;" | Description | ! style="font-weight: bold;background: #002060;color:#fbfcfd;width: 50%;" | Description | ||
|- | |- | ||
| − | | | + | |Brand|| brand of the car |
| − | |||
| − | |||
| − | |||
| − | |||
| − | |||
| − | |||
| − | |||
| − | |||
| − | |||
|- | |- | ||
| − | | | + | |Model||car model |
|- | |- | ||
| − | | | + | |Price||the price on the ad to sell the car |
|- | |- | ||
| − | | | + | |Depreciation||average depreciation value of the car per year |
|- | |- | ||
| − | | | + | |Registration Date||date the COE of the car is registered |
|- | |- | ||
| − | | | + | |Eng||engine of the car in terms of cc |
|- | |- | ||
| − | | | + | |Mile||how many kilometers the car has driven |
|- | |- | ||
| − | | | + | |Type||vehicle type |
|- | |- | ||
| − | | | + | |Status||if the car is still available for sale |
|- | |- | ||
| − | | | + | |Post date||date the advertisement was posted |
|- | |- | ||
| − | | | + | |Tags||tags associated with the advertisement |
|- | |- | ||
| − | | | + | |URL||the URL of the where the data was crawled from. |
|- | |- | ||
| − | |||
| − | |||
| − | |||
| − | |||
| − | |||
| − | |||
| − | |||
| − | |||
|} | |} | ||
Revision as of 20:15, 8 November 2017
Contents
Introduction
sgCarMart is one of Singapore's biggest online car resale marketplace. Specifically, it facilitates the resale of cars between a buyer and seller.
According to Forbes, there has been a huge increase in demand for used cars, as a result, the used car market has seen a stellar growth of up to 68% since 2009. This has led to huge changes in car buying behavior, marketplaces like sgCarMart are one of the key platforms paving way the growth of the used car industry. As a result, we tried to understand this market and its dynamics by crawling data from the sgCarMart's website.
Problem and Motivation
Prices of new cars can be too expensive for price sensitive individuals to afford. However, through the used car market one will be able to afford the convenience of owning a car. For budget conscious individuals, buying a used can be a great way to save money. On the other hand, owners of existing cars interested to make a sale can enjoy savings from its successful sale. Hence, understanding the used car market can prove to be useful for individuals looking to sell / buy a existing car.
In addition, with the changing consumer car buying behavior and a rising market for used cars, our aim is to understand this growing used car market to enable better decision making for the different stakeholders involved. When consumers look at used cars, usually the price is one of the most important factor that influences buying decision. In addition, we will also like to explore which other variables affect the price most and how they are correlated.
Objective
In this project, we are interested to create a visualisation application that helps users perform the following:
1. Visualise resale car prices against other factors such as:
- Type of cars
- Car Brands
- Car age
- Car Engine
- COE Date / COE Time Remaining
- Mileage
2. Identify relationships and correlations across different factors affecting resale prices
3. Uncover the top 10 most common brands for car resale
- Difference in prices & quantity sold across different brands
Data
Data used is obtained from crawling it off the sgcarmart website (http://www.sgcarmart.com/used_cars/listing.php). Specifically focusing on used cars.
This dataset contains 28028 records and consists of following columns.
| Attribute | Description |
|---|---|
| Brand | brand of the car |
| Model | car model |
| Price | the price on the ad to sell the car |
| Depreciation | average depreciation value of the car per year |
| Registration Date | date the COE of the car is registered |
| Eng | engine of the car in terms of cc |
| Mile | how many kilometers the car has driven |
| Type | vehicle type |
| Status | if the car is still available for sale |
| Post date | date the advertisement was posted |
| Tags | tags associated with the advertisement |
| URL | the URL of the where the data was crawled from. |
Research Visualisation
| Visualizations | Explaination |
|---|---|
|
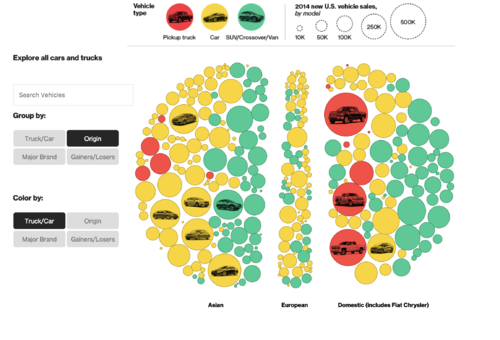
Bubble Chart
| |
|
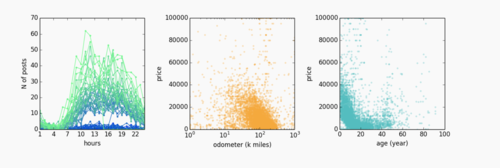
Scatter Plot
| |
|
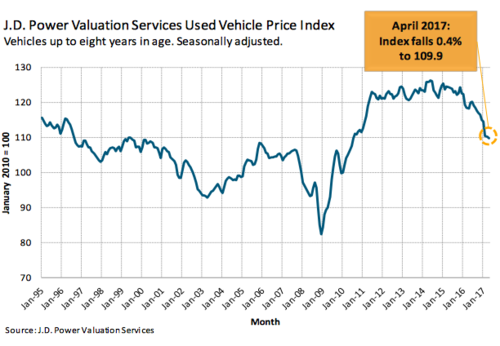
Line Graph
|
Tools
-Excel
-D3
-Javascript
-Github
-Tableau
Technical Challenges
| Technical Challenges | Action Plan |
|---|---|
| |
| |
|
Roles & Milestones
- Project Roles
Dong Ruiyan: Visualisation Analyst
Zhang Qian: Visualisation Designer
Jeremy LEE Ting Kok: Project Manager
- Project Timeline
References
- Bloomberg - Scientific Proof that Americans are Completely Addicted to Trucks: https://www.bloomberg.com/graphics/2015-auto-sales/
- Predict second hand car price using artificial neural network: http://csidsocialmedia.github.io/2014/05/02/Predict-second-hand-car-price-using-artificial-neural-network.html
- The Perfect Storm Hits Used-Car Values: The Foundation Of The Auto Industry Is Faltering: http://www.zerohedge.com/news/2017-05-21/perfect-storm-hits-used-car-values-foundation-auto-industry-faltering
- Kaggle - Used car database: https://www.kaggle.com/orgesleka/used-cars-database
- Kaggle - Data Crunchers: https://www.kaggle.com/timucinanuslu/data-crunchers
- D3.js: https://d3js.org/
- Chart.js: http://www.chartjs.org/


