Difference between revisions of "1718t1is428T11"
| Line 67: | Line 67: | ||
|- | |- | ||
| − | | | + | | [[Image: sp.png |500px|center]] || |
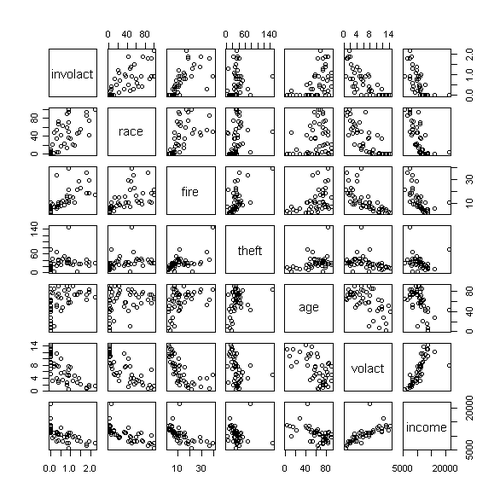
| − | * | + | '''Scatter Plot''' |
| + | * Scatter plot can help readers to see the relationship between two variables. | ||
| + | * In our case, we would like to see which variables are highly correlated with bidding price so that we could have a better understanding of the bidding behaviors. | ||
|- | |- | ||
| ADD PICS || | | ADD PICS || | ||
Revision as of 16:14, 14 October 2017
Contents
Introduction
BOSS (Bidding Online SyStem) is SMU's system for the registration of courses. BOSS is intended to empower students with the choice of selecting the courses/workshop they wish to enrol for in any one term. This choice is not necessarily an easy one. Based on available resources in the form of e-Dollars (e$) and e-Points (e-pt), students will need to make their choice by carefully considering the demand and supply of the courses/workshop as well as their academic study plan not just for the current term but also the future terms.
Problem and Motivation
With every bidding season, SMU students are faced with an uncertainty of the amount of e-Dollars (e$) to bid for the courses that they are interested to take the next semester. Often this arises due to the lack of insights and visualisation tools to effectively indicate past trends and details of courses. Despite past course bidding results data made publically available to students, it is difficult to make the right decisions without the support of any data aggregation and visualisation. Furthermore, it is difficult to gauge the demand and supply of upcoming courses/workshops. Hence there is a need to provide better decision support tools for student course bidding, we will create a visualisation application to help students and faculty understand the behaviour, interest and patterns of SMU courses .
Such visualisations will help uncover bidding behaviour and interest of the course that might prove useful for students, faculty, and course coordinators. The application will not only provide useful insights for students, it will also benefit the faculty and course coordinators in understanding courses that are high in demand. Which will allow them to allocate resources more effectively.
Objective
In this project, we are interested to create a visualisation application that helps users perform the following:
1. Visualise course information such as prices, popularity, class availability across all terms and bidding window
2. View trend of bidding prices for interested course
3. Uncover the demand and interest levels of each course based on the following variables
- Semester (Term 1,2)
- Class schedule
- Professor
- Number of classes available
Data
Data used is from “OASIS Boss Bidding History Results”. There are 21 excel files from 6 academic years. Every excel file contains 17 columns: term, session, bidding window, course code, description, section, vacancy, opening vacancy, before process vacancy, D.I.C.E, after process vacancy, enrolled students, max bid, median bid, min bid, instructor and school.
Research Visualisation
| Visualizations | Explaination |
|---|---|
|
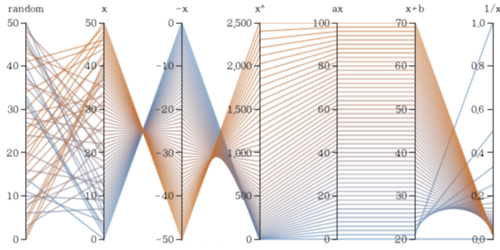
Parallel Coordinates
| |
|
Scatter Plot
| |
| ADD PICS |
|
Tools
-Excel
-D3
-Javascript
-Github
-Tableau


