Difference between revisions of "Visual Autolytic: Application"
Jump to navigation
Jump to search
| (9 intermediate revisions by 2 users not shown) | |||
| Line 5: | Line 5: | ||
| style="padding:0.3em; font-family:Raleway; background: #006768; text-align:center;" width="19%" | | | style="padding:0.3em; font-family:Raleway; background: #006768; text-align:center;" width="19%" | | ||
[[Visual Autolytics|<font color="#FFFFFF"><strong>Proposal</strong></font>]] | [[Visual Autolytics|<font color="#FFFFFF"><strong>Proposal</strong></font>]] | ||
| − | |||
| − | |||
| − | |||
| − | |||
| style=" background:#ffffff;" width="1%" | | | style=" background:#ffffff;" width="1%" | | ||
| Line 26: | Line 22: | ||
<div style="background:#006768; padding: 15px; font-weight: bold; line-height: 0.3em; text-indent: 15px; font-size: 20px;margin-top:25px"><font color=#FFFFFF>Web Application</font></div> | <div style="background:#006768; padding: 15px; font-weight: bold; line-height: 0.3em; text-indent: 15px; font-size: 20px;margin-top:25px"><font color=#FFFFFF>Web Application</font></div> | ||
| + | <b>[https://drive.google.com/open?id=1jP3N5kBcO2kUBOo1a4t_BAQeSFO0E2o1 Click HERE to download our project] </b> | ||
| + | <b>"This is our FULL user guide" : </b>[[Media:IS428 Visual Autolytics User Guide.pdf|User Guide]] | ||
{| class="wikitable" style="background-color:#FFFFFF;" width="100%" | {| class="wikitable" style="background-color:#FFFFFF;" width="100%" | ||
| − | + | ||
| − | |||
|- | |- | ||
| | | | ||
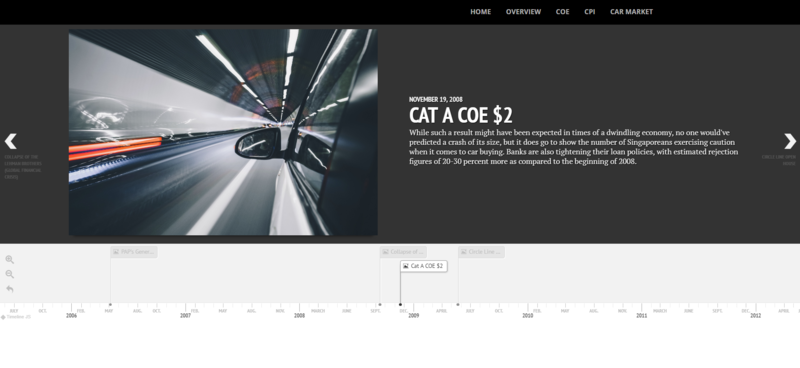
<p><center>''' Home Page: One Timeline to unite Us All ''' </center></p> | <p><center>''' Home Page: One Timeline to unite Us All ''' </center></p> | ||
| − | [[File: | + | [[File:Homepage1.PNG|center|800px]] |
|- | |- | ||
| | | | ||
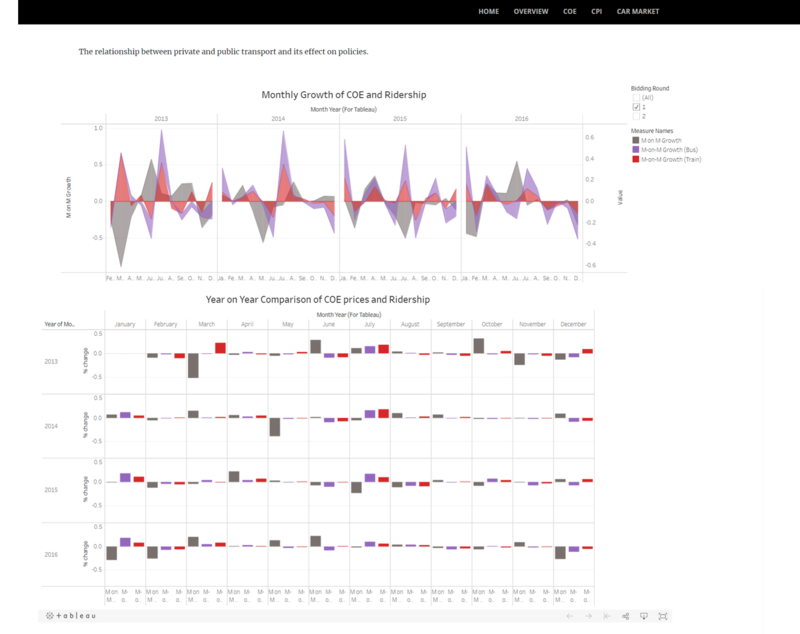
| − | <p><center>'''Overview: The relationship between public and private transport | + | <p><center>'''Overview: The relationship between public and private transport and effects of policies''' </center></p> |
[[File:Overview.png|center|800px]] | [[File:Overview.png|center|800px]] | ||
| Line 44: | Line 41: | ||
| | | | ||
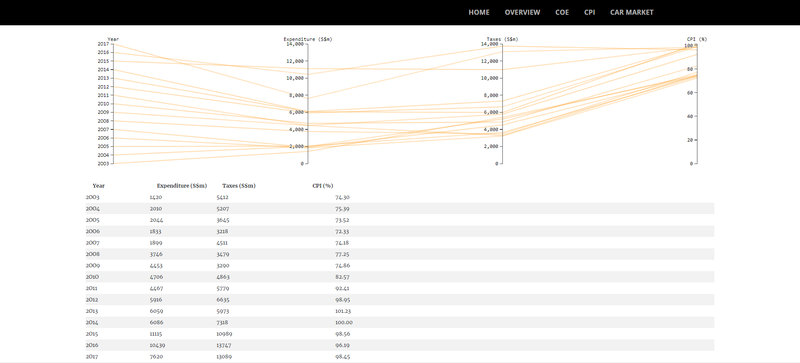
<p><center>'''COE: The relationship between COE prices and Demand Quantities''' </center></p> | <p><center>'''COE: The relationship between COE prices and Demand Quantities''' </center></p> | ||
| − | [[File: | + | [[File:Coe1.png|center|800px]] |
|- | |- | ||
Latest revision as of 00:36, 27 November 2017
Web Application
Click HERE to download our project "This is our FULL user guide" : User Guide
|
|
|
|
|
|
|
|
|
|
|
|
|
|
