File list
Jump to navigation
Jump to search
This special page shows all uploaded files.
File list
Items per page:
20
50
100
250
500
Search for media name:
Username:
Include old versions of files
Go
Date
Name
Thumbnail
Size
Description
Versions
23:44, 26 November 2017
Osvr-whitepaper-resource-icon.png
(
file
)
2 KB
2
22:35, 26 November 2017
Tax-ed Research Paper.pdf
(
file
)
683 KB
1
22:18, 26 November 2017
Tax-ed User Guide PDF.pdf
(
file
)
1.03 MB
3
01:24, 15 November 2017
Project poster.jpeg
(
file
)
4.82 MB
1
00:59, 15 November 2017
Project poster.jpg
(
file
)
4.82 MB
6
22:51, 15 October 2017
Proposed dashboard.png
(
file
)
827 KB
2
21:50, 15 October 2017
Bar tax.png
(
file
)
23 KB
1
21:15, 15 October 2017
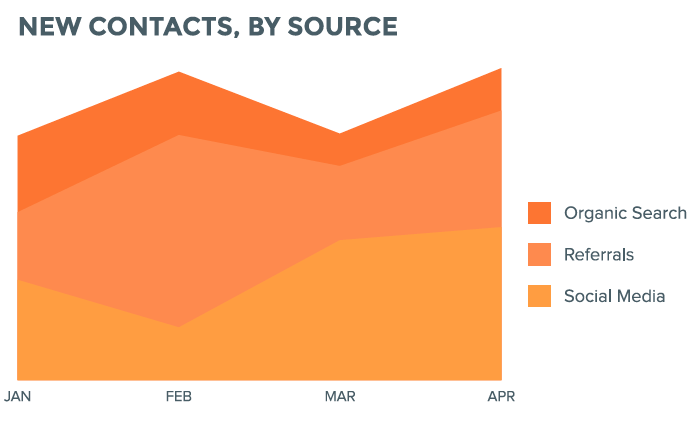
Area chart 2.png
(
file
)
7 KB
1
21:15, 15 October 2017
Area chart.png
(
file
)
6 KB
Reverted to version as of 13:14, 15 October 2017
4
21:10, 15 October 2017
PxR2k.png
(
file
)
10 KB
1
20:47, 15 October 2017
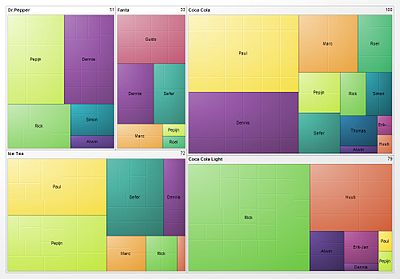
Gradient grouped treemap.jpg
(
file
)
17 KB
1
20:46, 15 October 2017
Many eyes treemap.png
(
file
)
44 KB
1
20:43, 15 October 2017
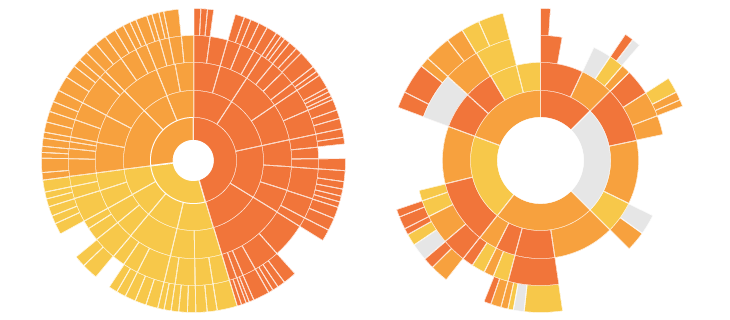
Sunburst diagram.png
(
file
)
70 KB
1
00:42, 15 October 2017
Tax break.JPG
(
file
)
103 KB
1
00:23, 15 October 2017
Tax revenue of Texas.png
(
file
)
277 KB
1
23:59, 14 October 2017
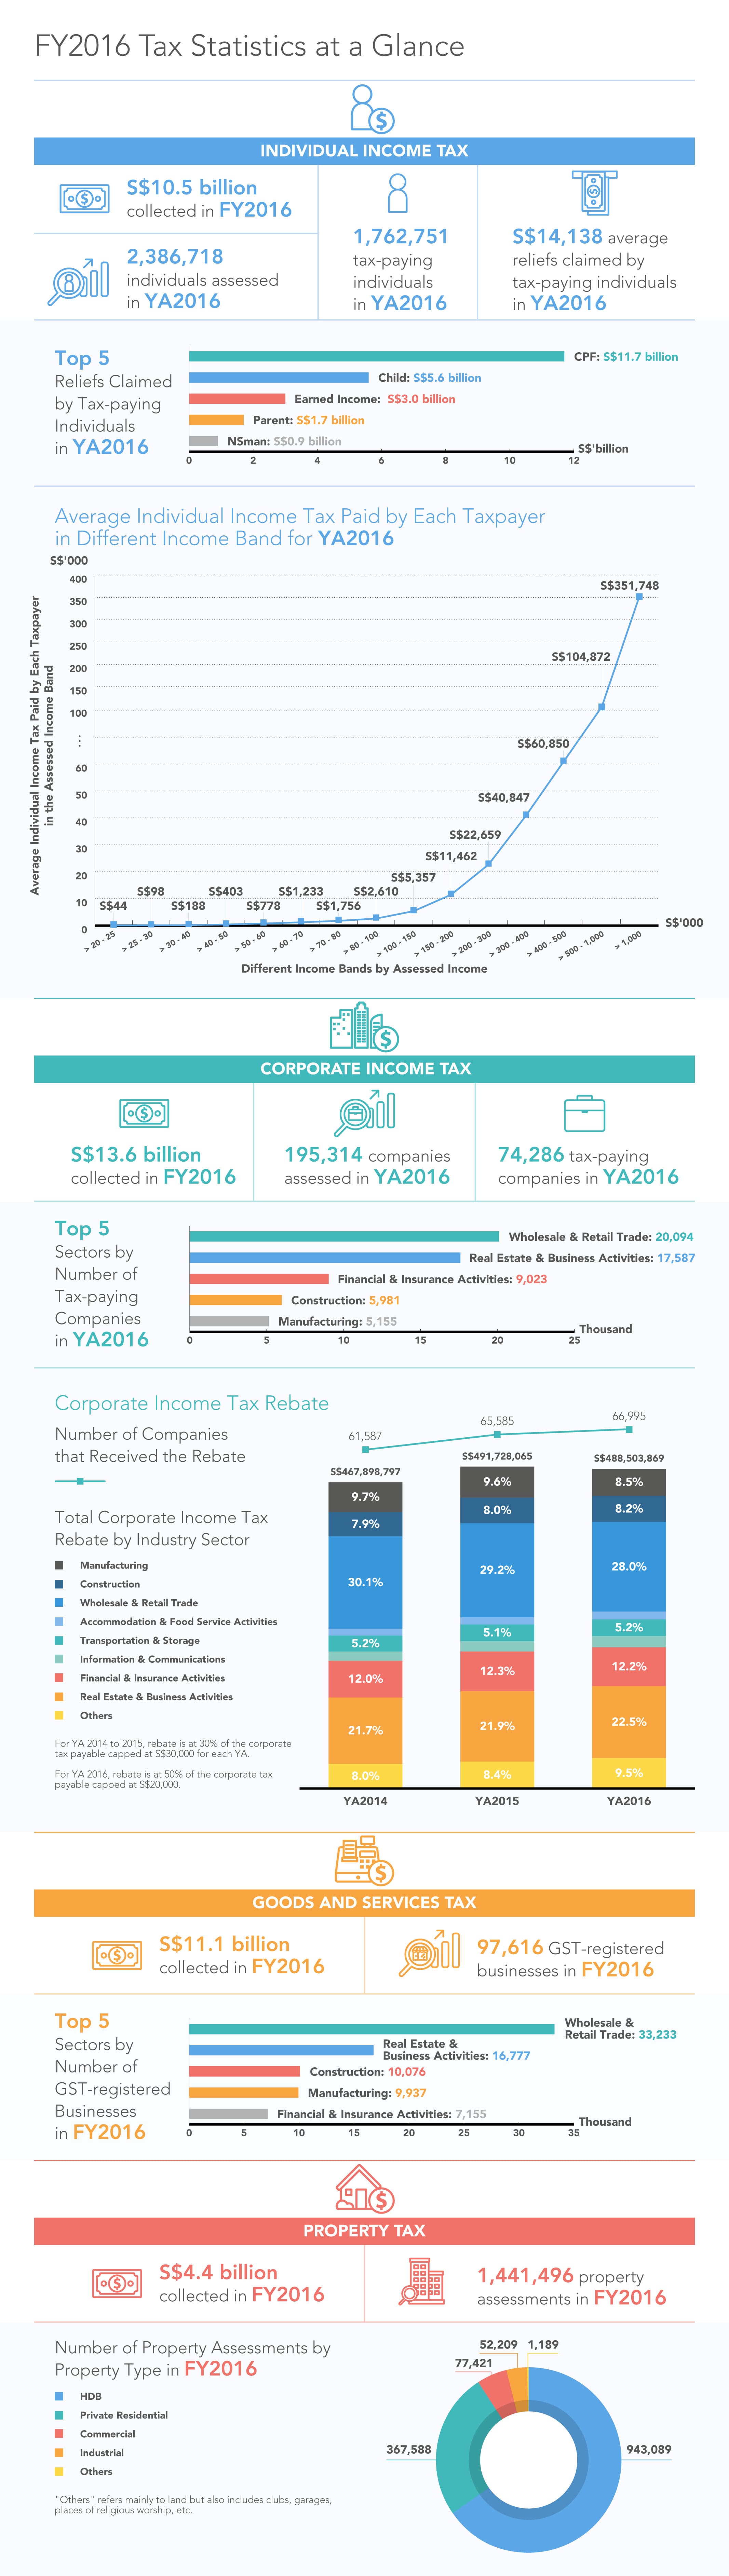
IRAS TaxStats-Info-graphics V06 FA-min.jpg
(
file
)
725 KB
1
23:37, 8 October 2017
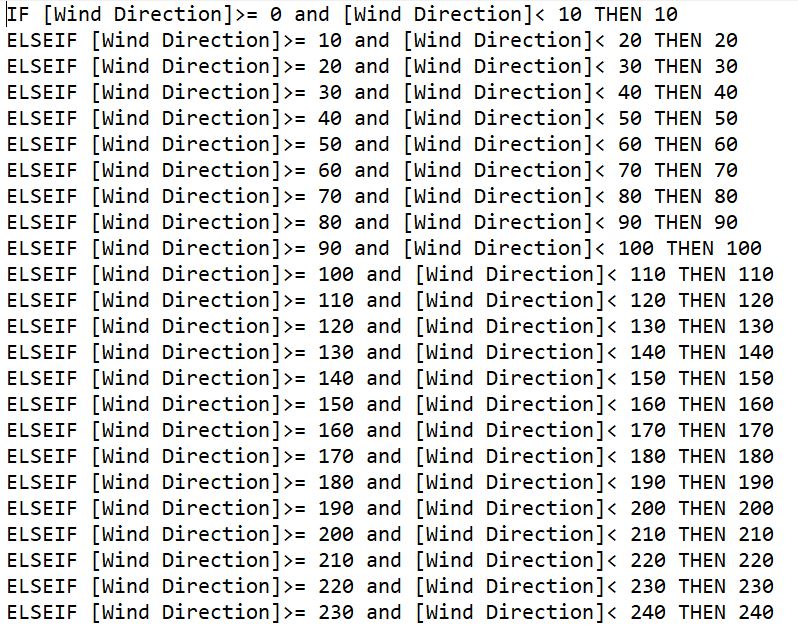
Code text.JPG
(
file
)
200 KB
1
23:34, 8 October 2017
Polygon capture.JPG
(
file
)
47 KB
1
23:29, 8 October 2017
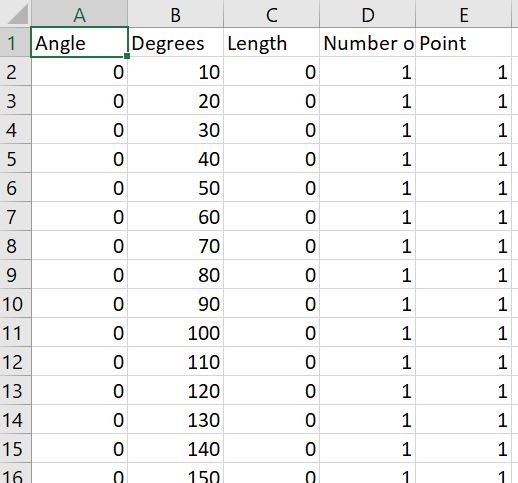
Cleaned data.JPG
(
file
)
22 KB
1
23:11, 8 October 2017
Line graph of Emissions by Sensor (12th Dec 0300).png
(
file
)
178 KB
1
23:02, 8 October 2017
Line graph of Emissions by Sensor (15th Apr 2100).png
(
file
)
230 KB
1
22:31, 8 October 2017
Chlorodinine triangle 2.png
(
file
)
293 KB
1
22:29, 8 October 2017
Chlorodinene triangle 1.png
(
file
)
300 KB
1
22:04, 8 October 2017
Line graph of Emissions by Sensor (7th December 01 00).png
(
file
)
183 KB
2
21:56, 8 October 2017
Emission of Chemical based on Hour of Day.png
(
file
)
104 KB
1
21:54, 8 October 2017
Scatterplot of Chemical Reading by Sensor 9.png
(
file
)
73 KB
1
21:53, 8 October 2017
Scatterplot of Chemical Reading by Sensor 8.png
(
file
)
73 KB
1
21:53, 8 October 2017
Scatterplot of Chemical Reading by Sensor 7.png
(
file
)
75 KB
1
21:52, 8 October 2017
Scatterplot of Chemical Reading by Sensor 6.png
(
file
)
73 KB
1
21:51, 8 October 2017
Scatterplot of Chemical Reading by Sensor 5.png
(
file
)
74 KB
1
21:51, 8 October 2017
Scatterplot of Chemical Reading by Sensor 4.png
(
file
)
79 KB
1
21:49, 8 October 2017
Scatterplot of Chemical Reading by Sensor 3.png
(
file
)
81 KB
1
21:48, 8 October 2017
Scatterplot of Chemical Reading by Sensor 2.png
(
file
)
71 KB
1
21:48, 8 October 2017
Scatterplot of Chemical Reading by Sensor 1.png
(
file
)
67 KB
1
21:37, 8 October 2017
Line graph of Emissions by Sensor (18th December 0900).png
(
file
)
172 KB
1
21:36, 8 October 2017
Line graph of Emissions by Sensor (15th April 1300).png
(
file
)
163 KB
1
21:35, 8 October 2017
Line graph of Emissions by Sensor (15th April 0800).png
(
file
)
167 KB
1
21:33, 8 October 2017
Line graph of Emissions by Sensor (12th April 1500).png
(
file
)
153 KB
1
21:33, 8 October 2017
Line graph of Emissions by Sensor (12th April 1200).png
(
file
)
162 KB
1
21:32, 8 October 2017
Line graph of Emissions by Sensor (7th December 01 00) - Wind Direction.png
(
file
)
181 KB
1
04:35, 8 October 2017
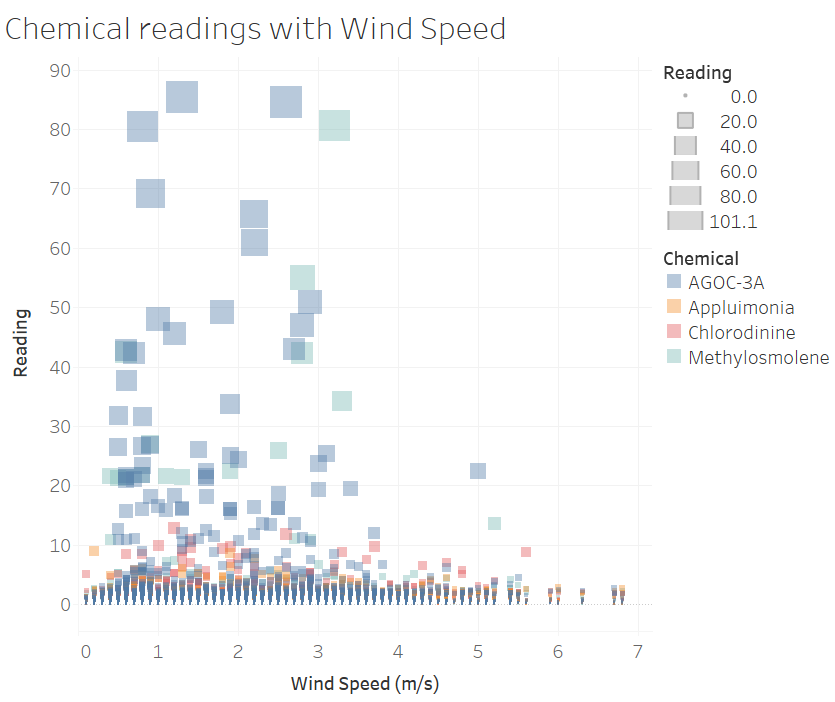
Chemical readings with Wind Speed.png
(
file
)
44 KB
1
Navigation menu
Personal tools
Log in
Namespaces
Special page
Variants
Views
More
Search
Navigation
Main Page
Course information
Project Groups
Recent changes
Terms of use
Wiki Policy
Intellectual Property
Help
Tools
User contributions
Logs
View user groups
Special pages
Printable version


.png)
.png)


.png)


.png)
.png)
.png)
.png)
.png)
_-_Wind_Direction.png)
