IS428 2017-18 T1 Assign Low Kang Li
Contents
Overview
Mistford is a mid-size city that located at the southwest of a large nature preserve. Mitch Vogel, a post-doc student who studying ornithology at Mistford College. He found out that the number of nesting pairs of local popular bird, Rose-Crested Blue Pipit is decreasing. The decrease is sufficiently significant that the Pangera Ornithology Conservation Society is sponsoring Mitch to undertake additional studies to identify the possible reasons. Mitch is gaining access to several datasets that may help him in his work, and he needs someone who is experts in visual analytics to help him analyse these datasets.
Mitch Vogel was immediately suspicious of the toxic gases that released from the smokestacks of the four manufacturing factories south of the nature preserve. He was almost certain that all manufacturing factories are contributing to the downfall of the Rose-Crested Blue Pipit bird. However, all the company representatives and workers seem to be nice people and very concern to the environment when he was talking to them.
In fact, Mitch was surprised that all factories had recently taken steps to make their processes more environmentally friendly, even though it increased their cost of production. Mitch found out that the state government has come out with a set of sensors that distributed around the factories, and set between the smokestacks in the city of Mistford and the nature preserve to monitor the gaseous effluents from the factories. Mitch has the access right to the state’s air sampler data, meteorological data, and locations map. Hence, Mitch needs someone who is good at visual analytics to help perform an analysis for him.
The Task
General Task
The four factories in the industrial area are subjected to higher-than-usual environmental assessment, due to their proximity to both the city and the preserve. Gaseous effluent data from several sampling stations has been collected over several months, along with meteorological data (wind speed and direction), that could help Mitch understand what impact these factories may be having on the Rose-Crested Blue Pipit. These factories are supposed to be quite compliant with recent years’ environmental regulations, but Mitch has his doubts that the actual data has been closely reviewed. Could visual analytics help him understand the real situation?
The primary job for Mitch is to determine which (if any) of the factories may be contributing to the problems of the Rose-crested Blue Pipit. Often, air sampling analysis deals with a single chemical being emitted by a single factory. In this case, though, there are four factories, potentially each emitting four chemicals, being monitored by nine different sensors. Further, some chemicals being emitted are more hazardous than others. Your task, as supported by visual analytics that you apply, is to detangle the data to help Mitch determine where problems may be. Use visual analytics to analyze the available data and develop responses to the questions below.
The Specific Tasks
Task 1: Characterize the sensors’ performance and operation. Are they all working properly at all times? Can you detect any unexpected behaviors of the sensors through analyzing the readings they capture?Limit your response to no more than 9 images and 1000 words.
Task 2: Now turn your attention to the chemicals themselves. Which chemicals are being detected by the sensor group? What patterns of chemical releases do you see, as being reported in the data? Limit your response to no more than 6 images and 500 words.
Task 3: Which factories are responsible for which chemical releases? Carefully describe how you determined this using all the data you have available. For the factories you identified, describe any observed patterns of operation revealed in the data. Limit your response to no more than 8 images and 1000 words.
Data Preparation
1. Remove unnecessary column in Meteorological Data dataset.
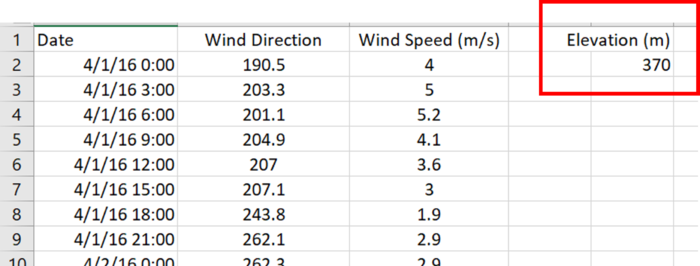
2. Remove empty row in Meteorological Data dataset.
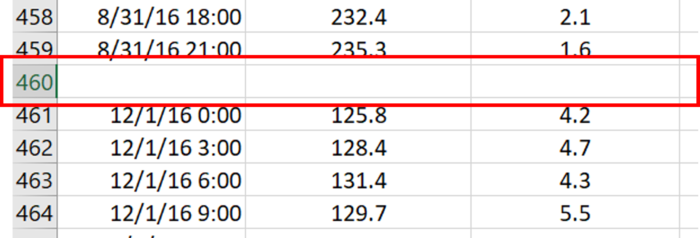
3. Fill in null value as 0 in Meteorological Data dataset.
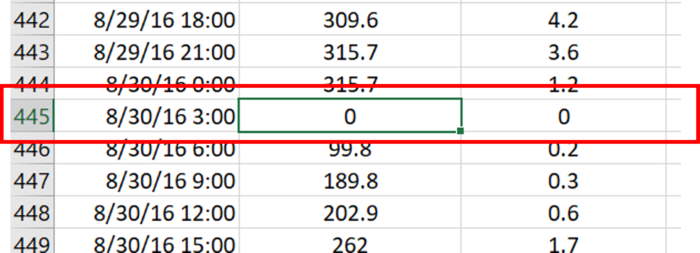
4. Calculate the data between two known data in Meteorological Data dataset.
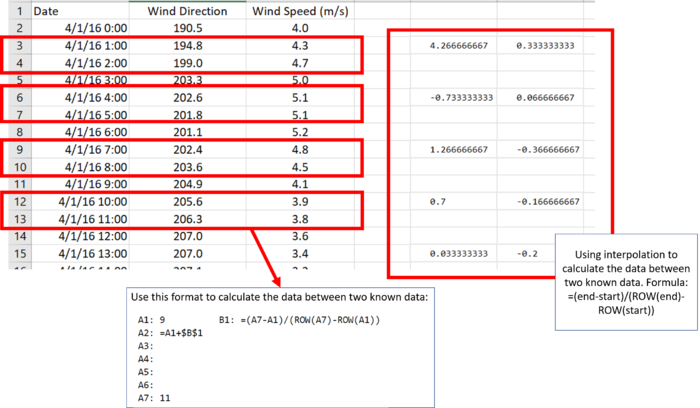
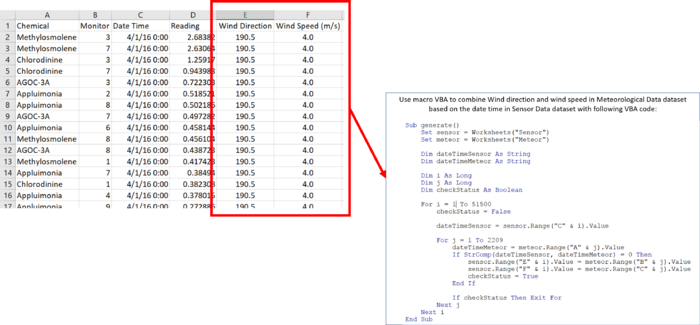
4. After calculating the data between two known data in Meteorological Data dataset, we combine wind direction and speed in Meteorological Data dataset to Sensor Data dataset by using VBA to assign automatically:
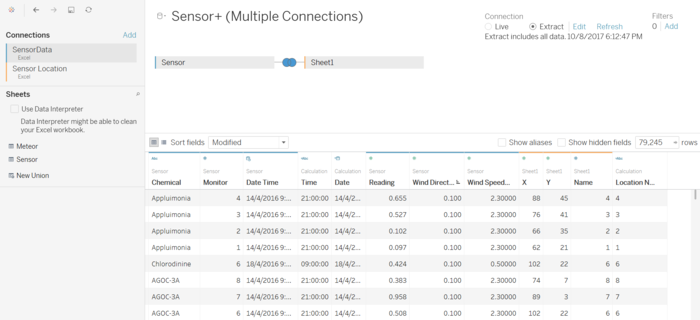
5. Upload Sensor Data dataset and Sensor Location dataset to Tableau and join them together.
Findings
Specific Task 1
Characterize the sensors’ performance and operation. Are they all working properly at all times? Can you detect any unexpected behaviors of the sensors through analyzing the readings they capture?
Visualization in Tableau Public
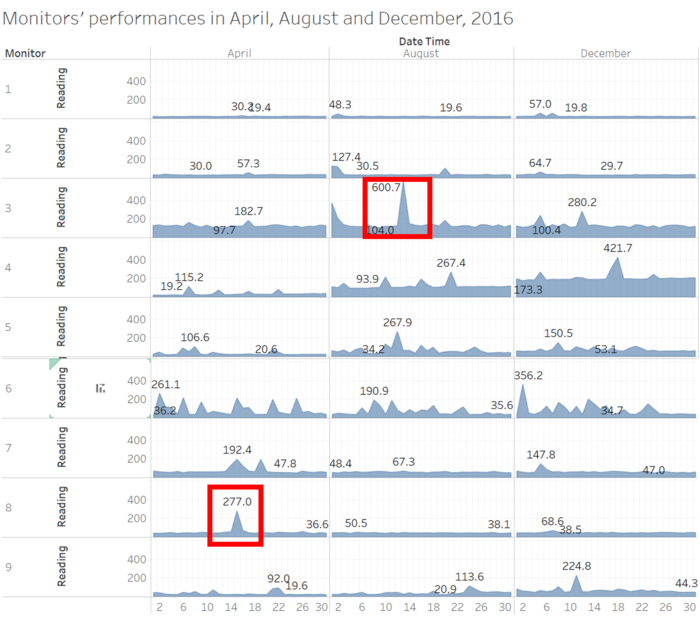
Based on the graph above, monitor 3 has abnormal detection in 13th August 2016 with a total readings of 600.7. Besides that, monitor 8 had an unexpected detection which is 277.0 on 15th April 2016. The reason of being unexpected detection on 15th April 2016 is because monitor 8 always had a steady detection over the months (April, August and December). Hence, a strike in 15th April had caused to unexpected detection.
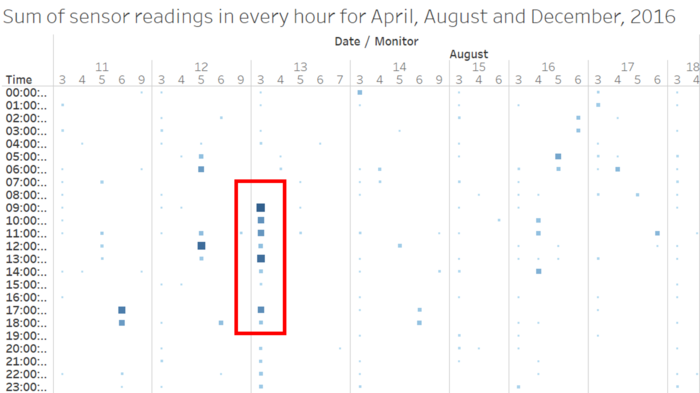
Monitor 3 has few abnormal detection on 13th August 2016 at time: 9am, 10am, 11am and 1pm with readings of 104.6, 62.9, 60.3, and 92.9 respectively.
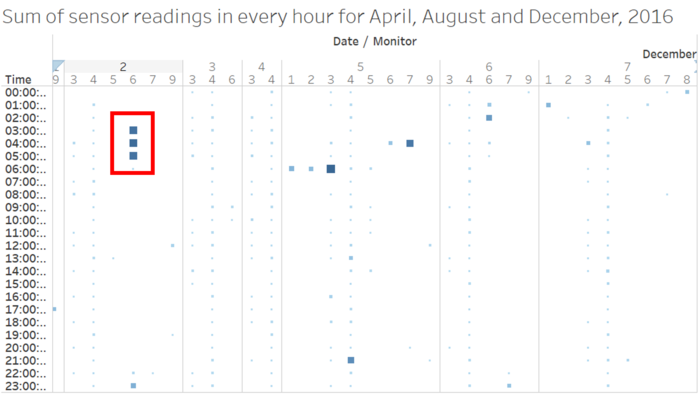
Monitor 6 has 3 abnormal detection on 2nd December 2016 at time: 3am, 4am and 5am with readings of 89.2, 94.7 and 88.2 respectively.
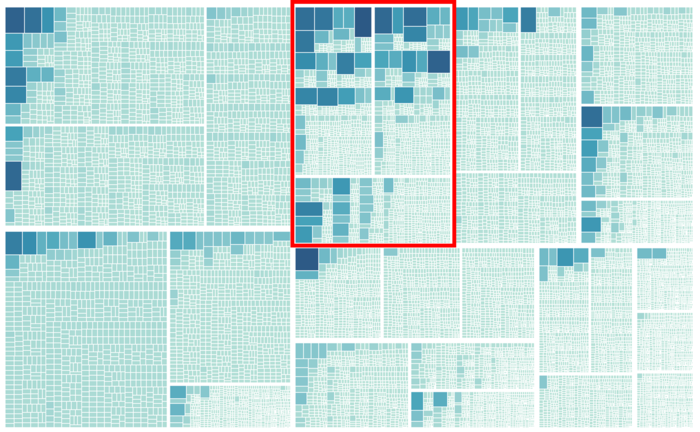
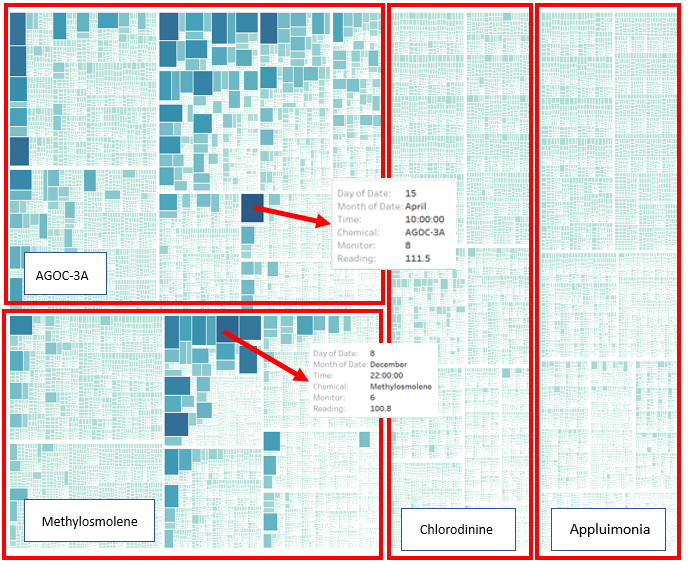
Based on the treemap above, monitor 6 always has abnormal detection compare to other monitors. It may cause by the factories that near to this monitor.
Specific Task 2
Which chemicals are being detected by the sensor group? What patterns of chemical releases do you see, as being reported in the data?
Visualisation in Tableau Public
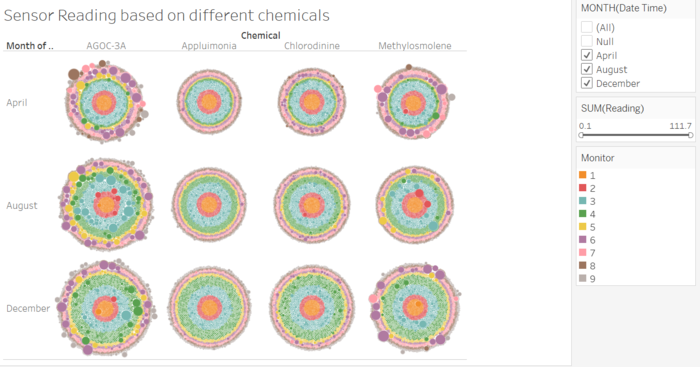
Based on the bubble chart above, the chemical AGOC-3A always has unexpected readings detected by the monitor 3 in April and August, monitor 4 in August and December, monitor 6 in April, August and December, and monitor 8 in April. Other than AGOC-3A, we also found out that Methylosmolene always has highest number of unexpected readings detected by monitor 6 in April and December 2016.
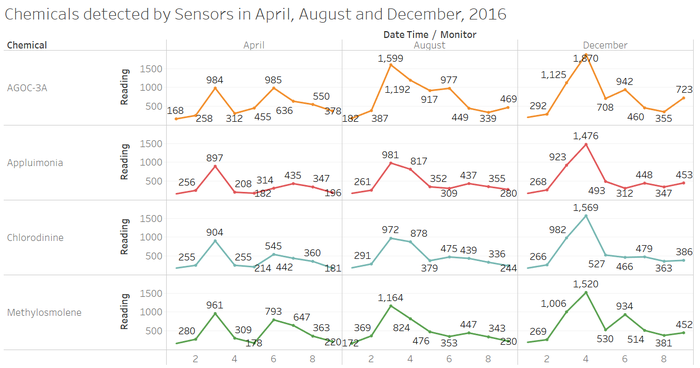
In April, monitor 3 has detected the highest sum of the amounts of each chemical which are AGOC-3A (984), Appluimonia (897), Chlorodinine (904), Methylosmolene (961). In August, monitor (sensor) 3 again detected the highest sum of the amounts of each chemical which are AGOC-3A (1599), Appluimonia (981), Chlorodinine (972), Methylosmolene (1164). The sum of the amount of chemical detected has been increased from April to August. In December, sensor 4 has detected the highest sum of the amounts of each chemical which are AGOC-3A (1870), Appluimonia (1476), Chlorodinine (1569), Methylosmolene (1520).
Based on the graph above, we found out that the total number of all chemicals have been increased over April, August and December 2016. According to the graph, most of the chemical released by the factories is AGOC-3A (4725 + 6512 + 6682 = 17919), followed by Methylosmolene (3917 + 4378 + 5804 = 14099), Chlorodinine 3337 + 4202 + 5219 = 12758) and Appluimonia (3001 + 3972 + 4898 = 11871).
Based on the graph above, the top 2 highest readings are chemical AGOC-3A detected by monitor 8 on 15th April 2016, 10am with readings 111.5 and Methylosmolene detected by monitor 6 on 8th December 2016, 10pm with readings 100.8.
Specific Task 3
Which factories are responsible for which chemical releases? For the factories you identified, describe any observed patterns of operation revealed in the data.
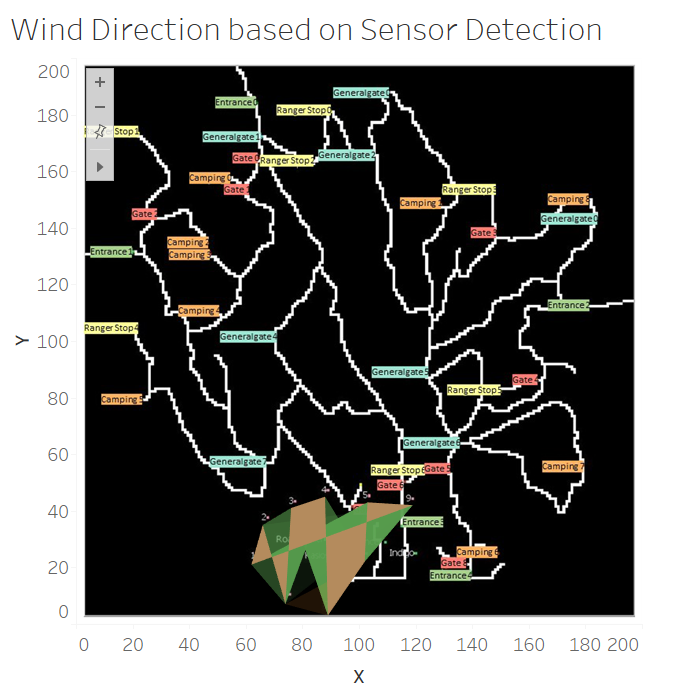
Based on the graph above, Radiance is responsible for all chemicals, Kasios is responsible for Methylosmolene and AGOC-3A, Roadrunner is responsible for AGOC-3A,Appluimonia, Chlorodinine and Methylosmolene, and Indigo is responsible for AGOC-3A.
Visualization Links
1. Sensor Performances: https://public.tableau.com/profile/low.kang.li#!/vizhome/SensorPerformanceFindingStory/SensorsPerformances?publish=yes
2. Chemical Detection: https://public.tableau.com/profile/low.kang.li#!/vizhome/ChemicalFindingsStory/SensorReadingbasedondifferentchemicalsinAprilAugustandDecember2016
3.Wind Direction based on Sensor detection: https://public.tableau.com/profile/low.kang.li#!/vizhome/WindDirectionBasedonSensorDetection/WindDirectionbasedonSensorDetection?publish=yes
Visualization Tools Used
- Tableau
- Excel VBA
Reference
1. Calculating interpolation : https://support.microsoft.com/en-sg/help/214096/method-to-calculate-interpolation-step-value-in-excel
