IS428 2017-18 T1 Assign Lim Jian Quan Jaren
Link to IS425 main: IS428 Main Page
Link to assignment: Assignment Overview
Link to dropbox: Assignment Dropbox
Contents
Problem & Motivation
Mistford is a mid-size city is located to the southwest of a large nature preserve. The city has a small industrial area with four light-manufacturing endeavors. Mitch Vogel is a post-doc student studying ornithology at Mistford College and has been discovering signs that the number of nesting pairs of the Rose-Crested Blue Pipit, a popular local bird due to its attractive plumage and pleasant songs, is decreasing! The decrease is sufficiently significant that the Pangera Ornithology Conservation Society is sponsoring Mitch to undertake additional studies to identify the possible reasons.
Mitch Vogel was immediately suspicious of the noxious gases just pouring out of the smokestacks from the four manufacturing factories south of the nature preserve. He was almost certain that all of these companies are contributing to the downfall of the poor Rose-crested Blue Pipit bird. But when he talked to company representatives and workers, they all seem to be nice people and actually pretty respectful of the environment.
In fact, Mitch was surprised to learn that the factories had recently taken steps to make their processes more environmentally friendly, even though it raised their cost of production.
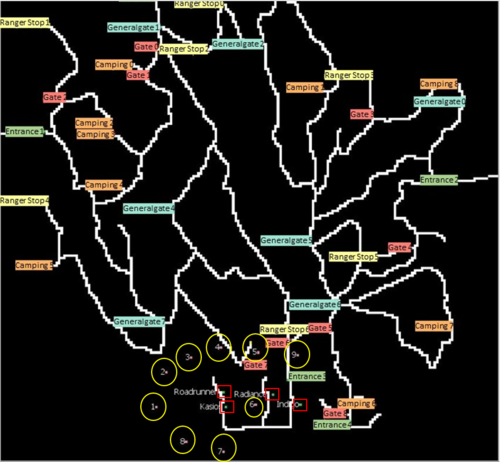
Mitch is gaining access to several datasets that may help him in his work, and he has asked you (and your colleagues) as experts in visual analytics to help him analyse these datasets. These datasets includes air sampler data, meteorological data, and locations maps provided by the state government, which has been monitoring the gaseous effluents from the factories through a set of sensors distributed around the factories.
Task
General Task
The four factories in the industrial area are subjected to higher-than-usual environmental assessment, due to their proximity to both the city and the preserve. Gaseous effluent data from several sampling stations has been collected over several months, along with meteorological data (wind speed and direction), that could help Mitch understand what impact these factories may be having on the Rose-Crested Blue Pipit. These factories are supposed to be quite compliant with recent years’ environmental regulations, but Mitch has his doubts that the actual data has been closely reviewed. Could visual analytics help him understand the real situation?
The primary job for Mitch is to determine which (if any) of the factories may be contributing to the problems of the Rose-crested Blue Pipit. Often, air sampling analysis deals with a single chemical being emitted by a single factory. In this case, though, there are four factories, potentially each emitting four chemicals, being monitored by nine different sensors. Further, some chemicals being emitted are more hazardous than others. Your task, as supported by visual analytics that you apply, is to detangle the data to help Mitch determine where problems may be. Use visual analytics to analyze the available data and develop responses to the questions below.
Specific Task
- Characterize the sensors’ performance and operation. Are they all working properly at all times? Can you detect any unexpected behaviors of the sensors through analyzing the readings they capture?Limit your response to no more than 9 images and 1000 words.
- Now turn your attention to the chemicals themselves. Which chemicals are being detected by the sensor group? What patterns of chemical releases do you see, as being reported in the data? Limit your response to no more than 6 images and 500 words.
- Which factories are responsible for which chemical releases? Carefully describe how you determined this using all the data you have available. For the factories you identified, describe any observed patterns of operation revealed in the data. Limit your response to no more than 8 images and 1000 words.
Dataset Analysis & Transformation Process
Contextual Information
We are provided with the following datasets:
- Sensor Data.xlsx: Indicates 1 of the 4 types of chemical detected in the air, the detected amount in parts per million, which sensor provided this reading, and the corresponding date-time
- Sensor Location.xlsx: Provides the X and Y coordinates of each of the 9 sensors
- Meteoroligcal Data.xlsx: Indicates the compass directions of where the wind is originating from (with North as the origin 000), the wind speed in m/s, and the corresponding date-time
Data Cleaning
The following data cleaning operations were conducted:
| S/N | Image | Issue | Cleaning Operation |
|---|---|---|---|
| 1 | Creates confusion in visualising data This value is not used across other rows. |
Removed elevation column | |
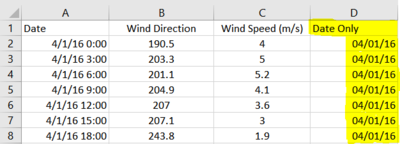
| 2 | Inconsistent datetime format 1hr interval for Sensor Data 3hr interval for Meteorological Data |
Created new "Date Only" column for easier manipulation |
Data Preparation & Joining
Data preparation and joining was done in Tableau such that the original datasets are not incorrectly manipulated.
| Task No. | Datasets used | Description |
|---|---|---|
| 1 | Sensor Data.xlsx Meteorological Data.xlsx |
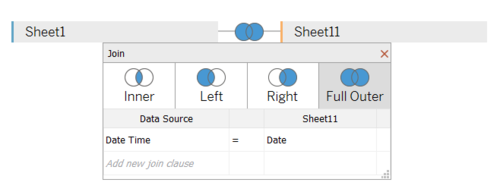
Full outer join between Date Time (Sensor Data.xlsx) and Date (Meteoroligcal Data.xlsx) |
| 2 | Sensor Data.xlsx Meteorological Data.xlsx |
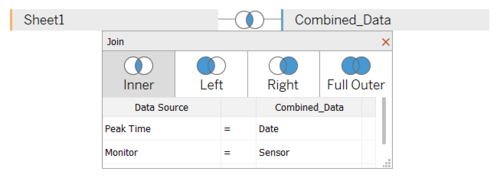
Inner join between
|
| 3 | Sensor Data.xlsx Meteorological Data.xlsx Sensor Location.xlsx |
Inner join between
|
Interactive Visualisation
The interactive visualization can be accessed here: https://public.tableau.com/profile/jaren.lim#!/vizhome/AssignmentLIMJIANQUANJAREN/Assignment
The resolution of the visualization is set at the size of 1366 x 768. The various visualisations contain filters and labels that allow viewers to make actions on the visualisations to aid with analysis.
Introduction
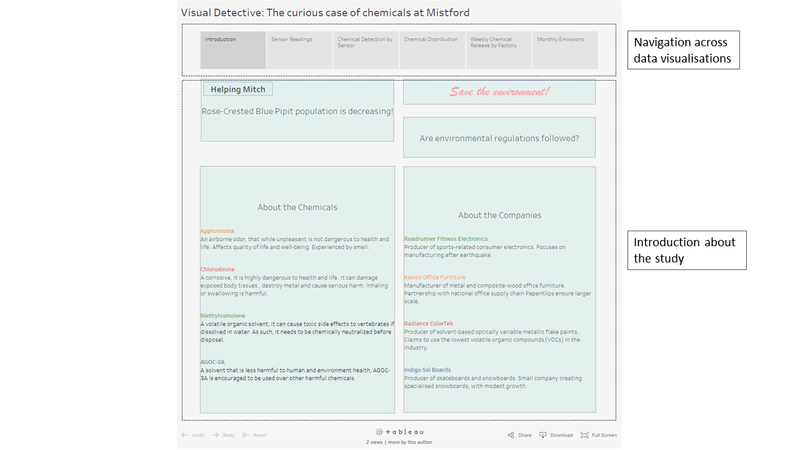
The introduction page serves as a homepage, with navigation tabs to the various visualisations - Sensor Readings, Chemical Detection by Sensor, Chemical Distribution, Weekly Chemical Release by Factory & Monthly Emissions. Viewers can access these visualisations to better aid in their analysis.
The following shows the introduction page:
Sensor Readings
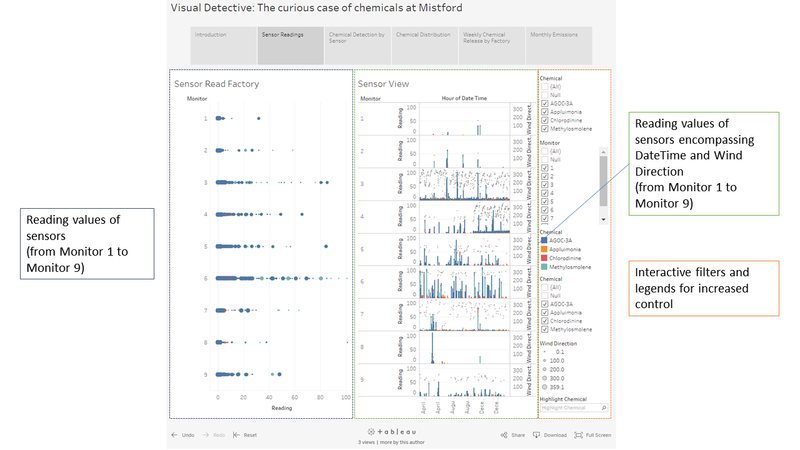
The Sensor Readings allow the viewer to better see the data collected by all nine monitors that are geographically distributed.
These are further broken down into
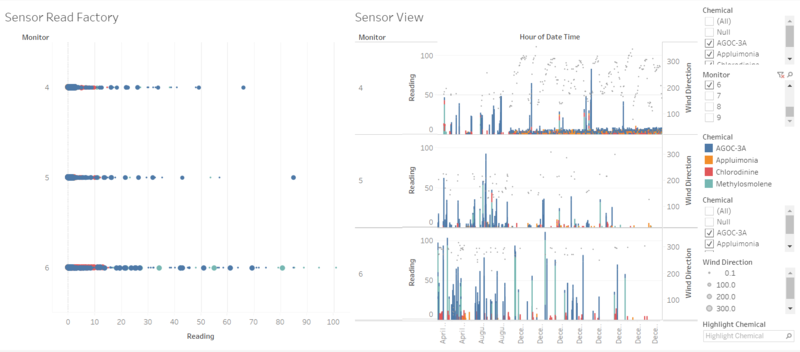
- Sensor Read Factory: Provides a view of the number of pollutants detected by a given sensor
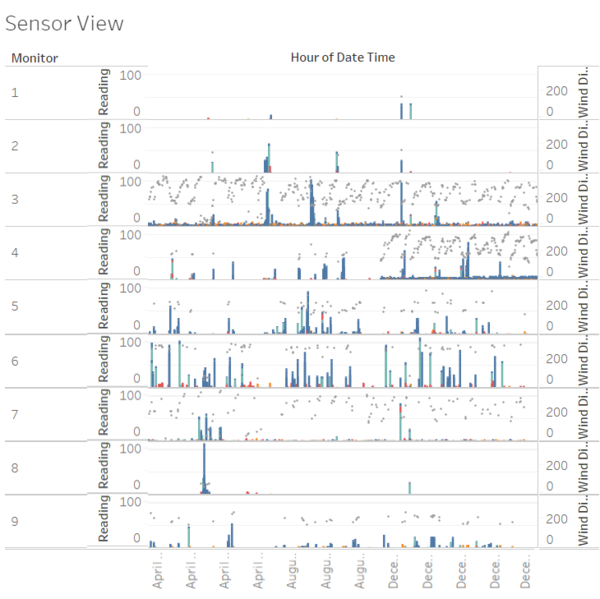
- Sensor View: Provides a view of all data collected by sensor, broken down by datetime
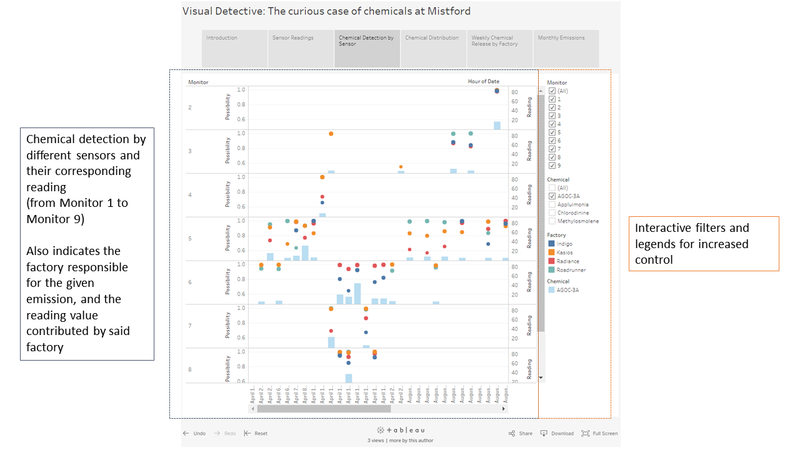
Chemical Detection by Sensor
The Chemical Detection by Sensor indicates to the viewer the detection of chemicals and their corresponding reading. This also visualises the factory responsible for the given emission, and the reading value contributed by said factory.
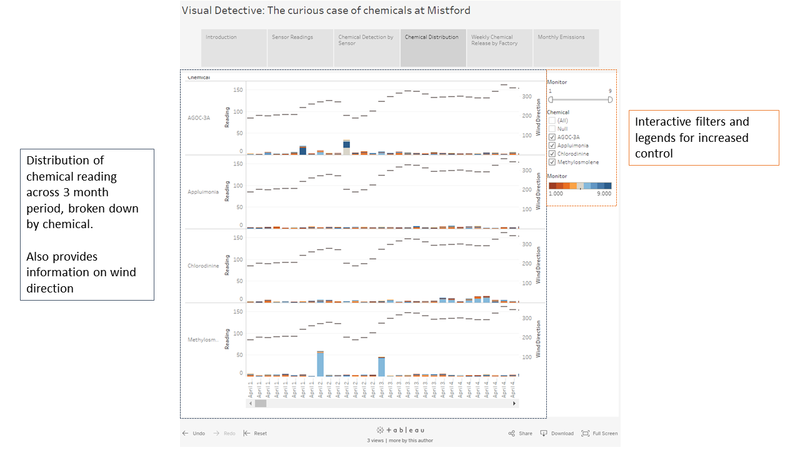
Chemical Distribution
The Chemical Distribution allows the viewer to view the distribution of the detected chemical in the air, across the time period of detection. This also accounts for the wind direction that shows the origination of the chemicals, and is ranked based on the quantity of chemical found in the air.
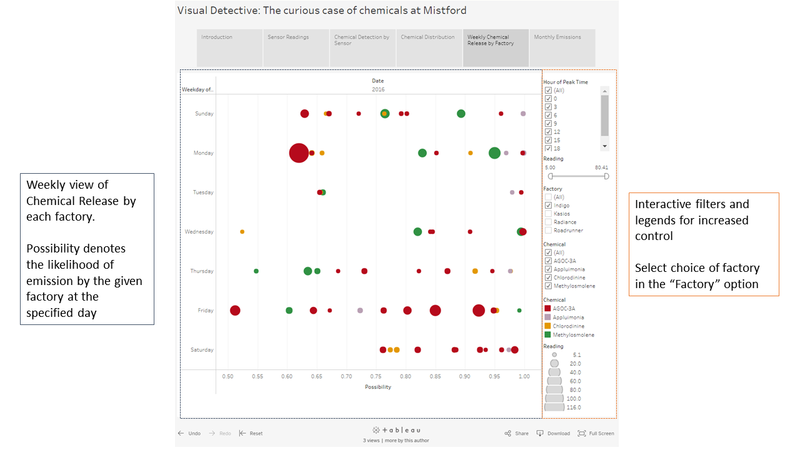
Weekly Chemical Release by Factory
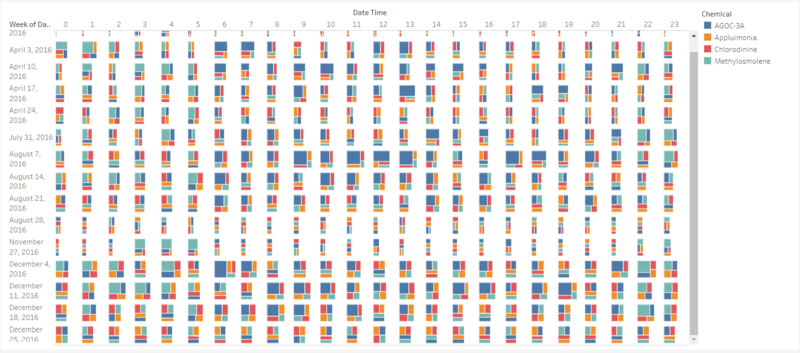
The Weekly Chemical Release by shows the emission of measured chemicals by each factory on a weekly basis (between Sunday to Saturday). This also indicates the possibility of emission at a given weekday.
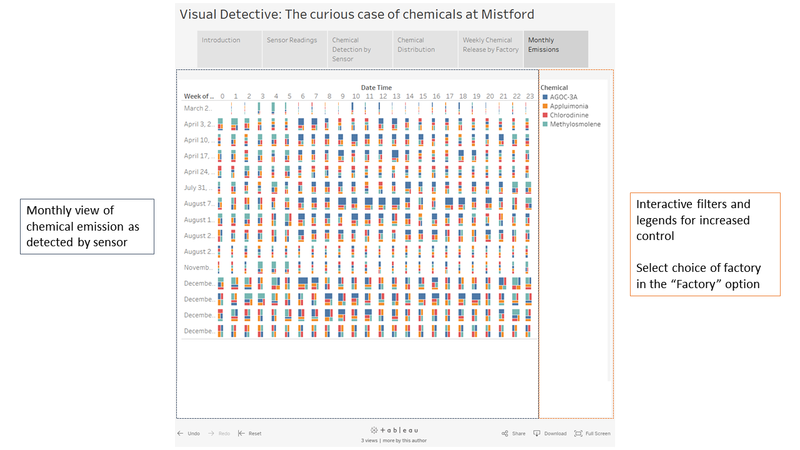
Monthly Emissions
The Monthly Emissions shows the emissions of the chemicals across the recorded months. The quantity of emission is reflected through the size of the plot.
Results
Task #1
Characterize the sensors’ performance and operation. Are they all working properly at all times? Can you detect any unexpected behaviors of the sensors through analyzing the readings they capture?Limit your response to no more than 9 images and 1000 words.
Overall all the nine sensors, which are measuring the four chemicals are functioning continuously across the sample time periods. From the dataset, we can see that readings are logged at hourly intervals, and the sensors are active all 24 hrs of the day.
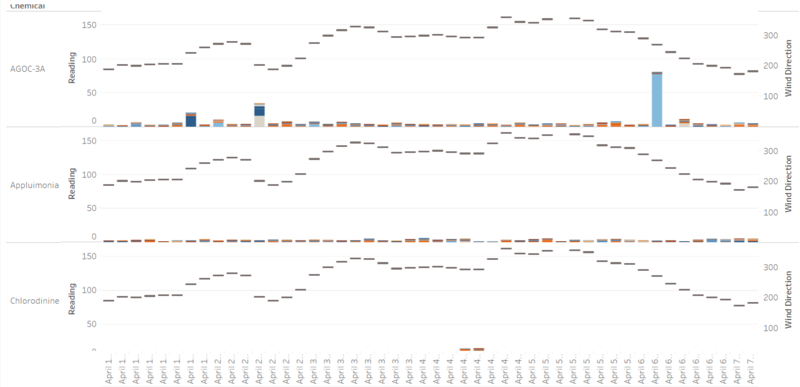
There are missing data points that coincide with certain timestamps. We can see that there are seven specific instances where there are missing records. They happen at 0000H on 2 April, 6 April, 2 August, 7 August, 2 December and 7 December. These missing data points occur around the same time as the spikes in chemical concentrations.
| |
|
| |
As a result, there might be a relationship between the points of consistently missing data and unusual chemical readings.
There are missing readings in all sensors that pick up Methylosmolene, especially for sensors 4, 5 and 6. These missing values coincide with duplicated readings of AGOC-3A in the same sensor.
There are a few possible explanations for this:
- Methylosmolene and AGOC-3A are similar in chemical composition, hence the sensors are unable to pick up the differences/nuances in this
- High concentration of chemical(s) could have affected the sensitivity of the sensors
- These errors can create incorrect high readings
- The sensors could be deliberately tampered with, to hide high readings of more dangerous chemicals
There is a general trend of increase in chemical readings that is noted by Sensor 4 but not by the others. This could mean that Sensor 4 is not calibrated properly, rather than assuming that local environment change occurred.
Task #2
Now turn your attention to the chemicals themselves. Which chemicals are being detected by the sensor group? What patterns of chemical releases do you see, as being reported in the data? Limit your response to no more than 6 images and 500 words.
We can first see that there is an increase in chemical readings in from April to December. For chemical levels to be on the rise, it means that the responsible culprits are emitting equal or more chemicals, at a rate that is higher than that of the chemicals being cleared out of the air.
A particularly worrying trend is that there are increases in the readings of Methylosmolene, Appluimonia and especially Chlorodinine. These chemicals are greatly harmful to the environment, wildlife and humans. The distribution of all four chemicals feature noise and occasional spikes of much higher readings. The largest spikes are shown for AGOC-3A and Methylosmolene, and the least spikes shown for Appluimonia.
| |
|
| |
|
While Sensor 4 seems to be erroneous, Sensor 5 is not. Given their close proximity, it is worth to take note of the increasing chemical concentrations found in the air as captured by Sensor 5, especially for Appluimonia, Chlorodinine and Methylosmolene. In addition, this is corroborated with the readings from Sensor 9, showing an increase in readings for all chemicals from August to December. This increase is especially shown in Chlorodinine which is dangerous, due to Chlorodinine being a corrosive, and the most hazardous of all measured chemicals.
Task #3
Which factories are responsible for which chemical releases? Carefully describe how you determined this using all the data you have available. For the factories you identified, describe any observed patterns of operation revealed in the data. Limit your response to no more than 8 images and 1000 words.
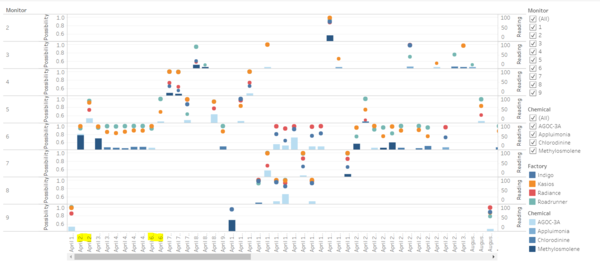
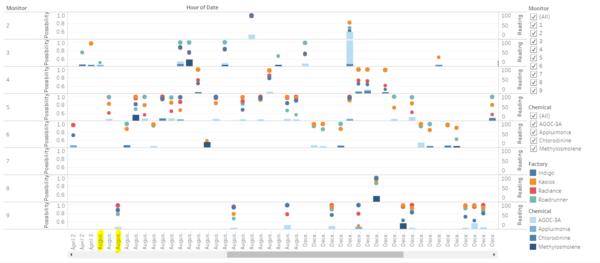
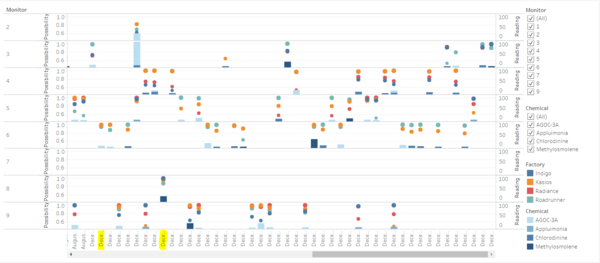
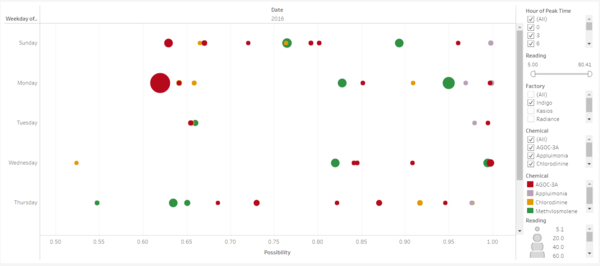
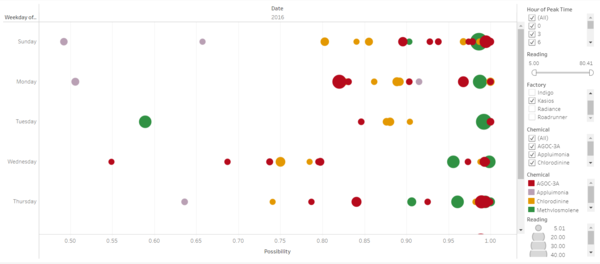
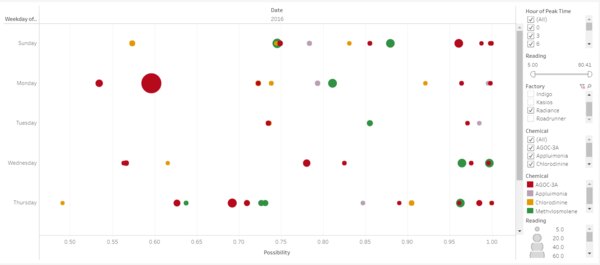
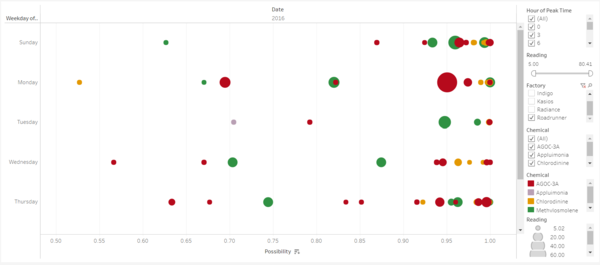
Correlating the sensor readings, wind direction and geographical location of sensors and the various factories, the culprits of contributing to chemical emissions are shown:
| Chemical | Polluting Company | Image |
|---|---|---|
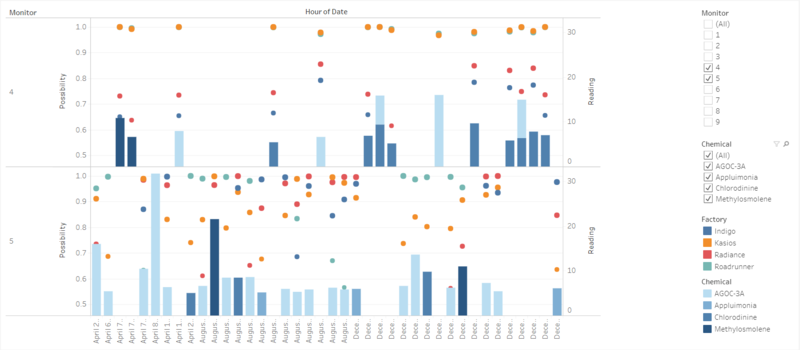
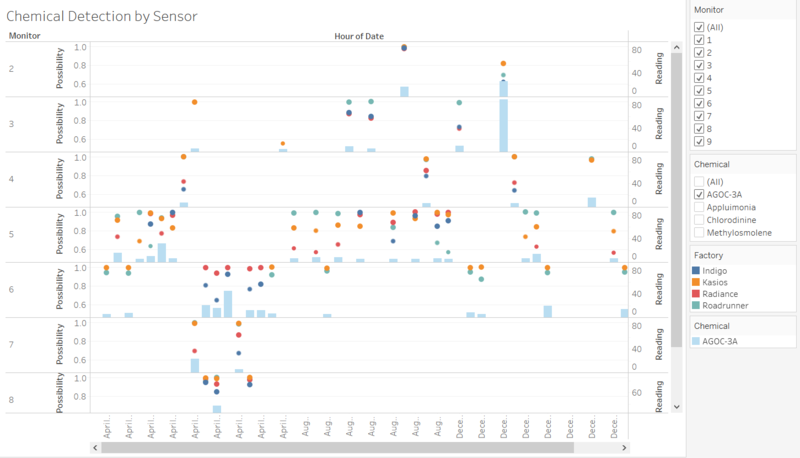
| AGOC-3A | Roadrunner Fitness Electronics Kaisos Office Furniture |
|
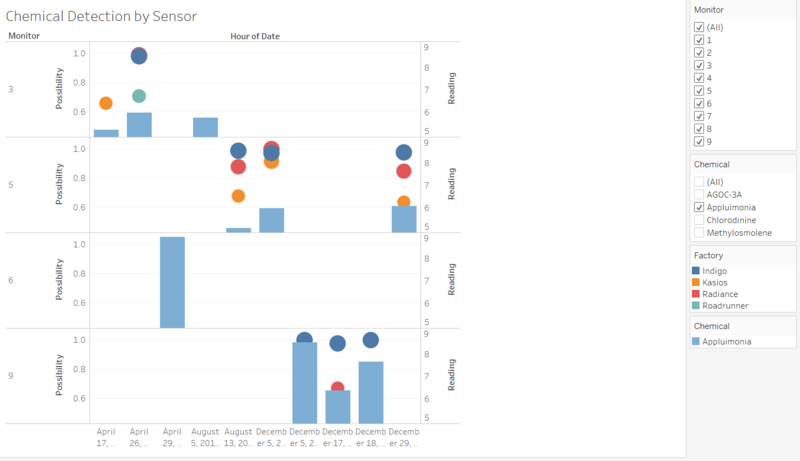
| Appluimonia | Indigo Sol Boards | |
| Chlorodinine | Roadrunner Fitness Electronics Kaisos Office Furniture |
|
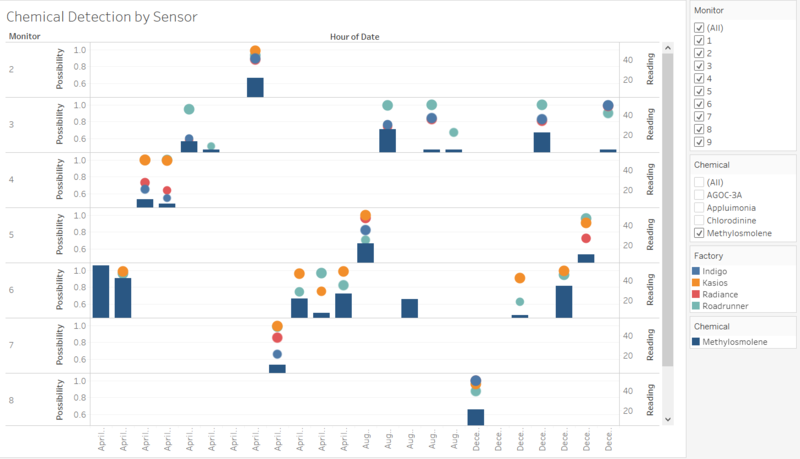
| Methylosmolene | Roadrunner Fitness Electronics |
The possibility value in the above visualisation depicts the likelihood of chemical contribution from the given factory.
What this tells us it that Roadrunner Fitness Electronics is responsible for most of the chemical emissions.
Taking reference from the position of the factories to the park, it can be seen that RoadRunner Fitness Electronics is closer in proximity to the nature reserve. Given that it produces majority of the chemicals (especially those of the harmful variety), this means that it is likely to be more culpable to the lowered population of Rose-Crested Blue Pipit. Since Roadrunner Fitness Electronics has now shifted to manufacturing and have been working in the aftermath of an earthquake, it is plausible that they do not make use of the necessary environmentally-friendly manufacturing techniques. Furthermore, as the manufacture sports-related consumer electronics, there will be a lot more raw materials and energy being used in their manufacturing process. Hence, it is likely that they will produce more of these chemicals.
Conclusion
What caused the population of Rose-Crested Blue Pipits in Mistford to decrease?
Holding all things constant, the increase in chemicals in the air would have affected the population of Rose-Crested Blue Pipits. The 9 sensors were calibrated to detect the presence of four chemicals: AGOC-3A, Appluimonia, Chlorodinine and Methylosmolene. Of these chemicals, the most deadly is Chlorodinine (corrosive), followed by Methylosmolene (organic solvent).
We have seen that there has been a rise in the amount of these chemicals in the sampled air, and this rise is inversely proportional the population size of Rose-Crested Blue Pipits. Furthermore with the explanation of what these chemicals can do, it is logical to determine that it was the increase of these chemicals being emitted by the factories at Mistford that caused this decline.
Who is the culprint?
First, we can see that all 4 factories (Indigo Sol Boards, Kasios Office Furniture, Radiance ColorTek, Roadrunner Fitness Electronics) have overall increased in their emission of chemicals. This is bad because it means that environmental rules are likely not adhered to.
But by breaking down the contributions of Chlorodinine and Methylosmolene, we can see that it is Roadrunner Fitness Electronics and Kasios Office Furniture who are most responsible for the emissions. They have contributed the most quantity, especially for Roadrunner Fitness Electronics, whose proximity is close to the nature reserve. This can be attributed to the nature of manufacturing they are doing. Roadrunner Fitness Electronics makes use of many raw materials when creating electronics, which also involve a lot of power. Hence, the rise of its chemical emissions can be traced to this. As for Kasios Office Furniture, their mix of metal and woodwork also means high power consumption and the emissions of such chemicals.
Closing remarks
This exercise is bounded by the readings from the sensors. While it is possible to check for the reliability of these sensors, it does not change the fact that this exercise in determining the decrease in Rose-Crested Blue Pipit is limited in scope. Chemical emissions sound like a plausible reason, however there are other factors that are not considered. Nevertheless, the data from the sensors is a good indicator that further checks on the factories' compliance to the environmental regulations should be made.

