IS428 2017-18 T1 Assign Cheow Wan Ling Taffy Joan
Contents
Assignment Details
The four factories in the industrial area are subjected to higher-than-usual environmental assessment, due to their proximity to both the city and the preserve. Gaseous effluent data from several sampling stations has been collected over several months, along with meteorological data (wind speed and direction), that could help Mitch understand what impact these factories may be having on the Rose-Crested Blue Pipit. These factories are supposed to be quite compliant with recent years’ environmental regulations, but Mitch has his doubts that the actual data has been closely reviewed. Could visual analytics help him understand the real situation?
The primary job for Mitch is to determine which (if any) of the factories may be contributing to the problems of the Rose-crested Blue Pipit. Often, air sampling analysis deals with a single chemical being emitted by a single factory. In this case, though, there are four factories, potentially each emitting four chemicals, being monitored by nine different sensors. Further, some chemicals being emitted are more hazardous than others. Your task, as supported by visual analytics that you apply, is to detangle the data to help Mitch determine where problems may be. As such we have been tasked to use visual analytics to analyze the available data. In doing so, we hope to uncover key insights that will address these key areas.
Key Task:
- Characterize the sensors’ performance and operation. Are they all working properly at all times? Can you detect any unexpected behaviors of the sensors through analyzing the readings they capture?Limit your response to no more than 9 images and 1000 words.
- Now turn your attention to the chemicals themselves. Which chemicals are being detected by the sensor group? What patterns of chemical releases do you see, as being reported in the data? Limit your response to no more than 6 images and 500 words.
- Which factories are responsible for which chemical releases? Carefully describe how you determined this using all the data you have available. For the factories you identified, describe any observed patterns of operation revealed in the data. Limit your response to no more than 8 images and 1000 words.
Problems and Motivation
With the passage of the Mistford Pact of 2010, the town and the Preserve have set into place certain safeguards to help ensure the safety of the people, animals, and vegetation of our area. When Mistford began growing its manufacturing industry, both the town and the companies wished to ensure an environmentally sound and economically supportive partnership. With these aims in mind, air sampling sensors have been placed near the town and in the Preserve to monitor air quality.
These sensors collect information on several substances of potential concern, including:
Appluimonia – An airborne odor is caused by a substance in the air that you can smell. Odors, or smells, can be either pleasant or unpleasant. In general, most substances that cause odors in the outdoor air are not at levels that can cause serious injury, long-term health effects, or death to humans or animals. However, odors may affect your quality of life and sense of well-being. Several odor-producing substances, including Appluimonia, are monitored under this program.
Chlorodinine – Corrosives are materials that can attack and chemically destroy exposed body tissues. Corrosives can also damage or even destroy metal. They begin to cause damage as soon as they touch the skin, eyes, respiratory tract, digestive tract, or the metal. They might be hazardous in other ways too, depending on the particular corrosive material. An example is the chemical Chlorodinine. It has been used as a disinfectant and sterilizing agent as well as other uses. It is harmful if inhaled or swallowed.
Methylosmolene – This is a trade name for a family of volatile organic solvents. After the publication of several studies documenting the toxic side effects of Methylosmolene in vertebrates, the chemical was strictly regulated in the manufacturing sector. Liquid forms of Methylosmolene are required by law to be chemically neutralized before disposal.
AGOC-3A – New environmental regulations, and consumer demand, have led to the development of low-VOC and zero-VOC solvents. Most manufacturers now use one or more low-VOC substances and Mistford’s plants have wholeheartedly signed on. These new solvents, including AGOC-3A, are less harmful to human and environmental health.
Task
- Characterize the sensors’ performance and operation. Are they all working properly at all times? Can you detect any unexpected behaviors of the sensors through analyzing the readings they capture?Limit your response to no more than 9 images and 1000 words.
- Now turn your attention to the chemicals themselves. Which chemicals are being detected by the sensor group? What patterns of chemical releases do you see, as being reported in the data? Limit your response to no more than 6 images and 500 words.
- Which factories are responsible for which chemical releases? Carefully describe how you determined this using all the data you have available. For the factories you identified, describe any observed patterns of operation revealed in the data. Limit your response to no more than 8 images and 1000 words.
Data Cleaning and Preparation
- Cleaning out data
Upon identifying a possible malfunctions with the sensor performance, we create a calculated field to reduce inaccurate data analysis.Taking into account the possible errors detected in the performance of the sensors, we create a calculated field that square-roots the original readings to dampen the effect of extreme values in the chemical readings that may negatively affect the analysis. Thus, the following analysis takes into account the cleaned readings.
- Addition of Polygon dataset for Wind Rose Plot
In order to plot the wind rose plot, additional dataset that comprised of the polygon info was joined to the existing meteorigical data. The following calculation was also used and a left join was selected.
Interactive Data Visualization
An interactive data visualization on the analysis can be found in the link provided. Link : https://public.tableau.com/profile/cheow.wan.ling.taffy.joan#!/vizhome/Assignment_235/Windflowdashboard
Data Analysis
- Performance of Sensors
Sensor Characteristics
[TABLE WITH EACH SENSOR SCATTER]
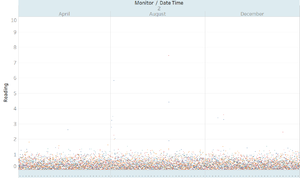
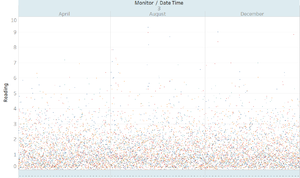
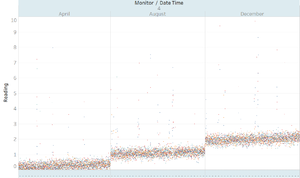
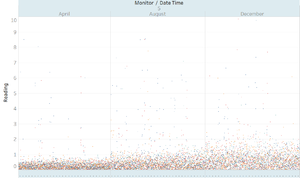
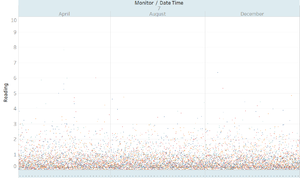
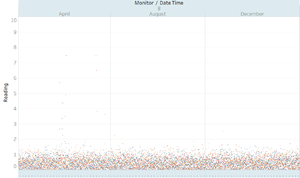
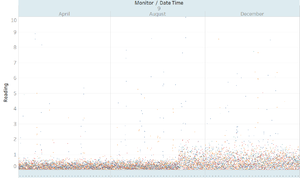
By plotting a scatter plot of the 9 sensors we can observe the following characteristics.
| Sensor & Sensor reading scatter plot | Characteristics |
|---|---|
| Sensor 1 | Relatively concentrated and consistent readings over all 3 months with occasional values that are out of the norm |
| Sensor 2 | Relatively concentrated and consistent readings over all 3 months. As compared to Sensor 1, Sensor 2 shows higher average readings over all 3 months |
| Sensor 3 | Among all 9 sensors, Sensor 3 has the most noise in its readings as seen in the dispersion and multiple fluctuations of data points over all 3 months |
| Sensor 4 | Chemical readings increase in each month depicting a step-like pattern |
| Sensor 5 | Sensor readings becomes noiser over time with increase dispersion of data points after each month |
| Sensor 6 | Relatively concentrated and consistent readings over all 3 months, however as compared to sensor 1 and 2, a larger number of chemical readings fall above the average chemical reading for Sensor 6 |
| Sensor 7 | Sensor readings show a relative amount of noise as compared to other sensors, however dispersion of data points over all 3 months are lesser than those observed in Sensor 3 |
| Sensor 8 | Relatively concentrate and consistent readings over all 3 months, however, more inconsistent readings are observed in the 1st month |
| Sensor 9 | Readings in April and August are more concentrated and consistent. Chemical readings become nosier from mid-August onward as seen in the increase dispersion of data points after mid-August. |
Sensor Event Log
In order to inspect the performance of the sensors, an event log heat map is utilized to inspect the number of readings taken by each monitor for each chemical every 1 hour. Ideally, each monitor should be taking 1 reading for each chemical every 1 hour as programmed.
[Event log heat map]
Upon observation of the heat map, the sensors appear to have random errors when taking chemical readings. Cited in multiple occasions, sensors may either take more than 1 reading or not take readings for one of the 4 chemicals as seen from the darker cells (equivalent to more than 1 reading count) or the white cells (equivalent to missing data). Such errors were not particular to a specific sensor or time as the errors presented randomly in any sensor or time.
Further analysis shows that multiple chemical readings only occur for the AGOC-3A chemical readings while missing checmical readings only occur for Methylosmolene chemical readings. We can also see that when the respective sensor picks up multiple reading for AGOC-3A at a specific time, the reading for Methylosmolene would also be missing at that exact hour and date. Taking readings from the month of April as an example, 2 readings were taken for AGOC-3A at 17th April 2016, 0700 while the chemical reading for Methylosmolene at 17th April 2017, 07 00 was missing. It can be deduced from these observations that during these malfunctions, one of the readings taken for AGOC-3A could be the reading for Methylosmolene instead which was wrongly assigned.
Missing readings during midnight
There were 2 occurrences where the sensor did not work at all as there was no chemical reading for either chemical during that hour. (2nd August 00:00, 7th December 00:00). This could be because the sensor was malfunctioning or shutdown due to maintenance.
- Pattern in Chemical Releases
To investigate this issue, we cross compare the chemical release to the date and time, sensor number, wind speeds and direction. The following are some of the patterns identified.
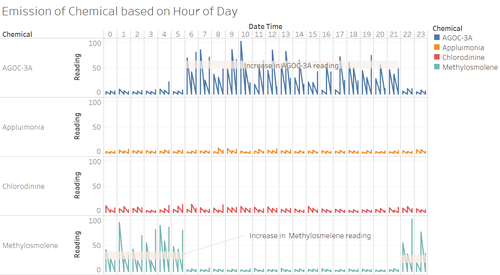
Increase in AGOC-3A and Methylosmolene chemical at certain hours of the day
By comparing the chemical readings ,picked up of all sensors,of each chemical across 3 months by the hour of the day, we observe that higher amounts AGOC-3A chemical is released in the day till night from 06 00 to 2100. Average readings during these hours (06 00 to 21 00) rose to 1.0 as compared to an average reading of 0.65 during other hours (22 00 – 05 00). Coincidentally, higher amounts of Methylosmolene chemical were released from 22 00 to 05 00, late in the night till morning. Average readings of Methylosmolene during these hours (22 00 to 05 00) were 1.0 as compared to an average reading of 0.584 during other hours (06 00 to 21 00). In contrast, the release of Appluimonia and Chlorodinine chemicals were consistent and low throughout the day in all 3 months with an average reading of 0.6 and 0.64 respectively.
Higher chemical readings with lower wind speeds
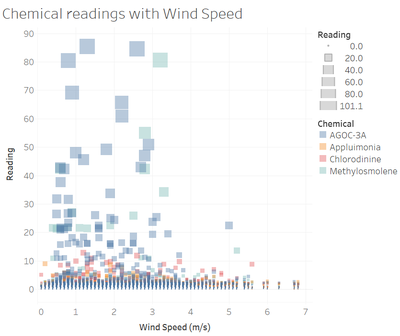
Readings are largely affected by wind speeds which as seen by the higher readings present when wind speed is lower. This could be because higher wind speed is likely to disperse the chemicals more quickly leading to lower concentrations of the chemical in the air thus resulting in lower readings.
Chemical releases picked up by sensors
Average readings of chemical readings at each sensor suggest that AGOC-3A are more concentrated in areas around Sensor 3,4,7 and 9.
Chemical Chlorodonine is concentrated in areas around Sensor 3 & 4.
- Relationship between Chemical and Factory
Methodology
In order to identify the relationship between chemical release and the factories, we examine the concentration of the chemicals measured by each monitor over time. With reference to the wind direction recorded, we can see the movement of chemicals over time upon being released into the air by looking the changes in chemical readings of each monitor over time. Taking into account the possible errors detected in the performance of the sensors, we create a calculated field that square-roots the original readings to dampen the effect of extreme values in the chemical readings that may negatively affect the analysis. Thus, the following analysis takes into account the cleaned readings.
Chemical release of AGOC-3A
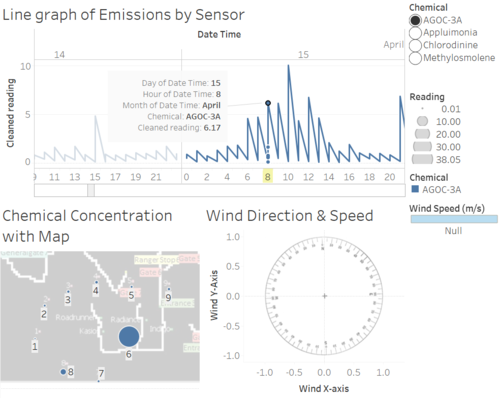
Higher AGOC-3A chemical readings is detected in Monitor 6 and 9 which brings evidence to Radiance ColourTek as the primary suspect to the high AGOC-3A chemical releases. For example, at 15th April 08 00hr, monitor 6 shows a high AGOC-3A chemical reading of 6.17. Overtime, the chemical is dispersed southwest towards monitor 8 result in the increase in AGOC-3A reading in monitor 8 (10.1) and a decrease in AGOC=3A chemical readings in monitor 6 (1.16). Hence depicting a movement of AGOC-3A originating from Radiance ColourTek.
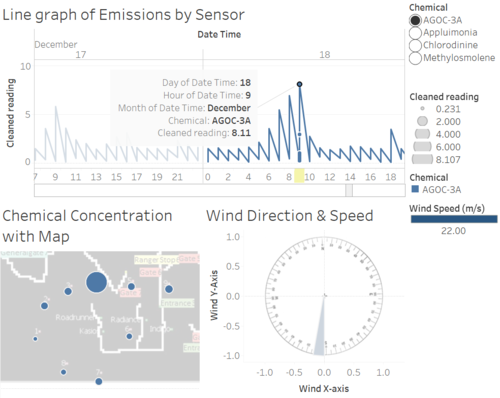
Release of AGOC-3A can also be associated with Roadrunner or Kasios with occasional high AGOC-3A readings measured by Monitor 3.For example on 17th December 09 00hr and 18th December 09 00hr where the AGOC-3A reading at monitor 3 measured 5.81 and 8.81 respectively.
Chemical release of Appluimonia
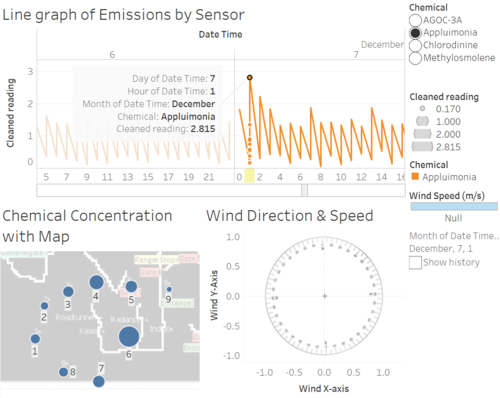
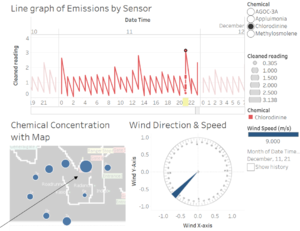
Although the average readings for Appluimonia for monitor 3 is the highest at 1.033, Release of Appluimonia is likely to traced back to Radiance ColourTek or Indigo as a result of prevailing wind from the Southeast. For example, we see that chemical reading for monitor 6 was highest on 7th December 01 00hr with a chemical reading of 2.82. Reading at monitor 6 then decreases overtime while chemical readings of Monitor 4 and 7 increase overtime as the chemical is carried towards that direction, depicting the origin of the chemical to be around monitor 6.
Chemical release of Chlorodine
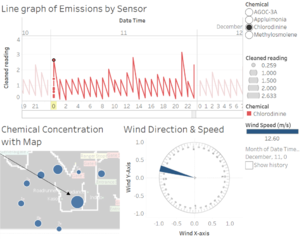
Evidence of chemical release of Chlorodinine points towards factories around monitor 3 and 6, Roadrunner or Kasio. For example on 9th April , 13 00hr , chlorodinine levels around Monitor 3 was showed a level of 1.465 while monitor 6 measured a chemical reading of 1.459. At 9th April,15 00hr, following northwest wind direction at 23.4m/s, chemical readings of chlorodinine at monitor 3 decreased while concentrations of chlorodinine remained high, with a chemical reading of 3.438 by monitor 6.
Further analysis of chemical readings and wind direction allow us to pin point the origin of chlorodinine release to closer to Roadrunner factory. However, since the 2 factories are close, it is difficult to isolate the origin of the chemicals as there could be possibility that the chemical released traveled its surrounding area.
Chemical release of Methylosmolene
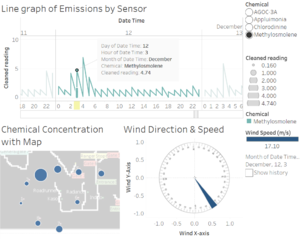
Significantly higher chemical readings of Methylosmolene were measured at monitored at 3 and 4, 1.06 and 1.01 respectively. Further analysis of the spatial distribution of chemical concentrations during the spikes in Methylosmolene in chemical readings. For example, on 12th December, 03 00hr, monitor 3 measured a chemical reading of 4.740 for methylosmolene. Chemical reading for monitor 3 increased to 6.91 at 04 00hr as southeastern wind carried the chemical towards monitor 3 and away from monitors 6.
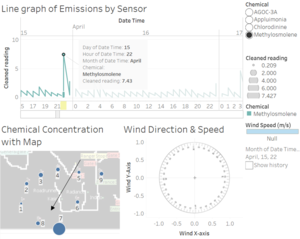
On 15th April, 21 00hr, we can also see that methylosmolene emission are carried towards monitor 7 from surrounding areas.By triangulating based on the evidence presented, chemical readings suggest that methylosmolene is being released by Kasio since it is nearest to Monitor 6. The central location of Kasios factory among all monitors is also aligned to the dispersion of methylosmolene readings in all monitors.
Conclusion
Hence in conclusion, we can attribute the release of AGOC-3A to Radiance ColourTek, Roadrunner Fitness Electronics or Kasios Office Furniture with Radiance ColourTek being the primary contributor to the release of AGOC-3A chemical. Next the release of Chlorodine can be attributed to Roadrunner Fitness Electronics. The release of Methylosmolene can be traced to Kasios while the release of Appluimonia can be traced to Radiance ColourTek or Indigo Sol Board


