ISSS608 2016-17 T3 Group5 Immigration Intro
|
|
|
|
|
|
|
Overview
Motivation of the Application
Migration is a big issue in the international relations and foreign policy. As a phenomenon, migration is not new, and people have been moving from place to place since the dawn of time.
Migration could be either permanent or temporal. At a more general level, the causes of migration are varied, ranging from social, political, to economic reasons. Theories of migration tend to focus on push-pull factors of source and destination countries. However, any migration flow is both a product of these factors as well as the relevant immigration policies of regulating cross border flows. Given all these factors, it is difficult to study the determinants of migration. Nevertheless, migration remains a very important topic of study today. In recent years, anti-immigrant sentiments has been growing particularly in the more developed West. Driven by fears of displacement, competition for jobs and dilution of national and/or ethnic identity amongst local populations, the issue of migration has been much politicised. The wave of popular dissatisfaction with migration-related issues have even resulted in Brexit and the Election of President Trump. Yet, migration is one of the building blocks of an international economy and having the ability to cross borders is a key factor in building up the economies of both sending and receiving countries. Understanding the factors that affect the causes and the flows of migration provide an important lens in interpreting the landscape of the international political economy.
Challenges of visualising migration - Past work reviews
Due to the complex nature of migration, any attempt to create a visualisation of migration data would encounter many difficulties and challenges. The following is a list of visualisation challenges we’ve encountered in our study of past attempts at visualising migration flows as well as our own attempts at designing a visualisation:
- Multidimensionality of migration data
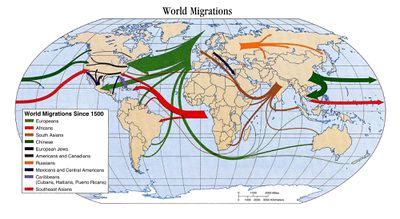
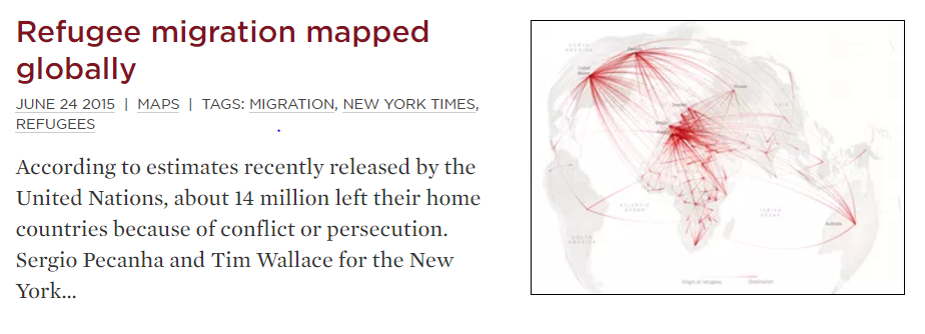
Migration data can be represented by stocks and flows. The former refers to the stock of migrants in a country, and the latter refers to the flow from country to country. Other than being perceived as pair-wise flows between countries, migration flow data could also be represented by a net migration figure. All these have implications on how the data can be visualised. Social migrants migrate in search of a better quality of life, refugees and asylum seekers leave their home countries to escape political persecution or conflict, or to escape natural disasters, or even migrants trafficked for sex or labour exploitation. Many attempts at visualising these flows have used world maps and coloured lines between regions with vary thickness to represent migration flows from source to destination countries as well as the volume of the flow respectively.
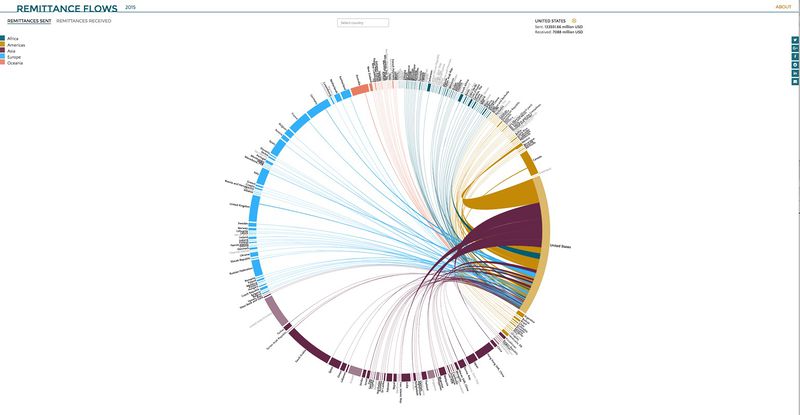
Economic migrants who migrate to destination countries work and stay on a temporary basis are considered as transnational migration flows. One way in which transnational migration flows have been represented is through the proxy indicators of remittance flows. This is premised on the assumption that transnational migrants would send money back to their hometowns and origin countries through remittance transfers. Attempts to visualise these flows (http://www.torre.nl/remittances/#?direction=sent) have also relied on Chord Diagrams, where countries are lined up in a circle and coloured by their regions; while remittance flows are represented by chords connecting these countries (see Figure below).
Of course, Chord Diagrams have also been used to visualise migrant flows (http://www.global-migration.info/). Another way in which flows has been represented is through the use of a scrolling slope graph, as can be seen in People Movin’(http://peoplemov.in/).


