ISSS608 2016-17 T3 Assign Group5 Immigration Proposal
|
|
|
|
|
|
|
|
Proposal
For our ISSS608 project, we would like to create a visualization app for migration flows.
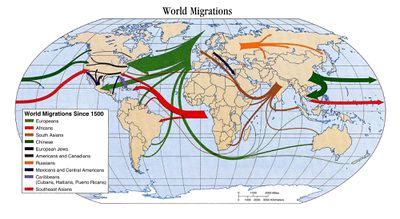
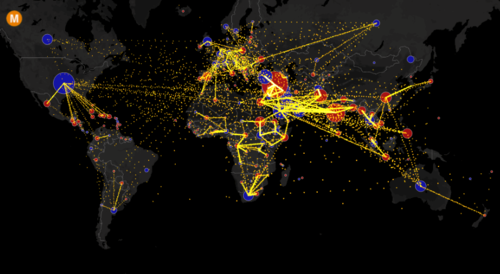
Visualisations of migrations tend to involve the use of world maps, choropleth maps, and/or chord diagrams. The most unique attempt uses a stacked graph. Currently, many attempts at visualising migration flows are more descriptive rather than analytic, focusing on the flows (particularly on the type) rather than the reasons for the flows. Examples range from general migration data, to refugees, and even human trafficking flows. There have also been attempts to visualize migration using proxies, such as tax return data and remittance data. Visualisations that attempt to move beyond flows do so by providing data on the characteristics of the source and destination countries. However, any information that accompanies the visualisation tends to focus on the attributes of both countries rather than provide any analytical link explaining the flows.
This may be because migration as an issue is extremely big and crosses over a wide range of topics and disciplines. As a phenomenon, migration is not new, and people have been moving from place to place since the dawn of time. Migration could be either permanent or temporal. The causes of migration are varied and people move for various reasons. Broadly speaking, the motivation for migration can be broken down to 4 main categories:
- economic
- social
- political
- environmental
Theories of migration tend to focus on push-pull factors as first conceived by Ernest Ravenstein where negative factors in one country “push” people out and positive factors “pull” people in. Most contemporary approaches to migration – be it neoclassical economics, segmented labour market theory, or the world systems approach – have fundamentally not departed from Ravenstein’s thesis. As the reasons that people migrate are varied, a more comprehensive theory of migration is difficult to formulate and most studies of migration that move beyond a descriptive level tend to address the effects and implications of migration rather than the causes of migration itself. This may explain why most of the visualisations we have found on migration tend to remain at the descriptive level rather than attempt to provide an analytic lens.
For our ISSS608 project, we would like to move beyond the current visualisations and attempt to create an app that could provide an additional analytic lens, using additional data on country characteristics with economic data from the World Bank, and Geert Hofstede’s cultural dimensions data. This app focuses on allowing the user to explore not only the migration flows, but the push and pull factors behind these flows by visualizing the various country attributes as differential levels that may correlate with the magnitude and degree of migration.
References
 #   https://www.nytimes.com/interactive/2014/08/13/upshot/where-people-in-each-state-were-born.html#Utah
 #   http://metrocosm.com/global-immigration-map/
 #   https://www.nytimes.com/interactive/2015/06/21/world/map-flow-desperate-migration-refugee-crisis.html?_r=0 and https://flowingdata.com/2014/01/09/a-visual-exploration-of-refugee-migrations/
 #   http://dataviz.du.edu/projects/htc/flow/#SGP/in/sex
 #   https://flowingdata.com/2012/02/08/animation-shows-national-migration-patterns/
 #   http://www.torre.nl/remittances/#/?direction=sent&country=
 #   http://peoplemov.in/ and http://migrationsmap.net/#/USA/arrivals
 #   http://www.harpercollege.edu/mhealy/migrat/xp/mgraven.htm

