ISSS608 2016-17 T3 Assign AKANGSHA BANDALKUL Q3
Akangsha Bandalkul VAST Challenge - MC2
|
|
|
|
|
|
|
|
Which factories are responsible for which chemical releases? Carefully describe how you determined this using all the data you have available. For the factories you identified, describe any observed patterns of operation revealed in the data.
Background Information
Overview of the meteorological data set
When approaching this question, the first step done is to understand the distributions of the meteorological dataset that is provided. This is done through JMP.
Date
Just as the data for the sensor readings, the meteorological data provided is for the months of April, August and December. However, the data here is provided on a 3-hourly basis, instead of every hour.
It is important to note here that there are fewer records for August compared to the other two months. There is also one row of missing values for the date column.
Wind Direction
The wind direction data provided points back to the origin of the wind based on the information provided in the VAST data descriptions.
As can be seen, wind direction ranges from 0.1 degrees to 359.1 degrees. There are also two missing values in this column which will need to be dealt with.
Wind Speed (m/s)
The wind speed data provided is in metres per second. This data will need to be transformed to miles per hour and then the equivalent number of “boxes per hour” to match the coordinate grid provided for the Mistford map. There, the 200 x 200 grid represents an area of 12 miles x 12 miles.
As can be seen, the wind speed data is relatively low, ranging from 0.1m/s to 6.8m/s. There are also two missing values in this column.
Elevation (m)
The elevation data has not been explained in the VAST guidelines.
It is important to note that there are 706 missing rows for this data. Only 1 record is provided but without further explanation it is hard to understand whether the elevation is only relevant to the one record it belongs to or if it should be considered the elevation height for all of the wind sensors or the chemical sensors.
Data Cleaning
For this data set, the rows with missing values in the date time, wind speed are excluded and hidden so that they are not considered in further data preparation steps that will be done to prepare the visualisation for this question.
The elevation column is also excluded as there is insufficient background information provided to include it in the analysis.
VAST Answer
The Four Chemicals Tracked
As meteorological data is only available every three hours, we do not know what the wind direction is for the two hours between each reading. In order to avoid incorrect assumptions being made, we focus on high chemical readings during hours for which meteorological data is available.
To find out which are the high readings for each chemical, we can use the line graph at the top of the “Mapping Back to Factories” dashboard to filter the line graph for each chemical and month.
For example, this is the line graph produced for Methylosmolene in April:
By selecting each peak, the wind plot below the graph is filtered to reflect i) the sensor for which this reading appears ii) the wind speed and direction towards the origin of the chemical. Using this information we can determine the likely source of the chemical.
For example, when the highest peak of Methylosmolene reading in April is selected (graph below):
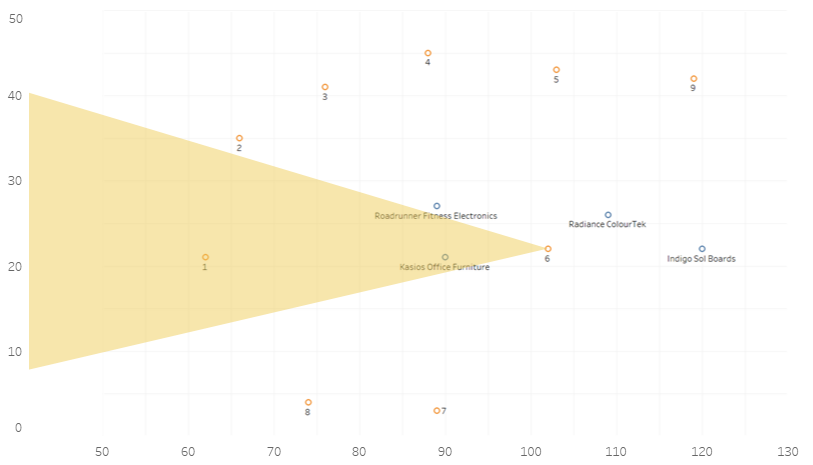
The wind plot changes to reflect the below. From here it can be determined that the likely source is Kasios Office Furniture.
Please note that the current wind calculations are done based on a spread of 30 degrees. It is possible that wind plumes from factories cover a wider area, therefore, there is a functionality which allows the angle spread to be changed from between 30 to 60 degrees via the dashboard.
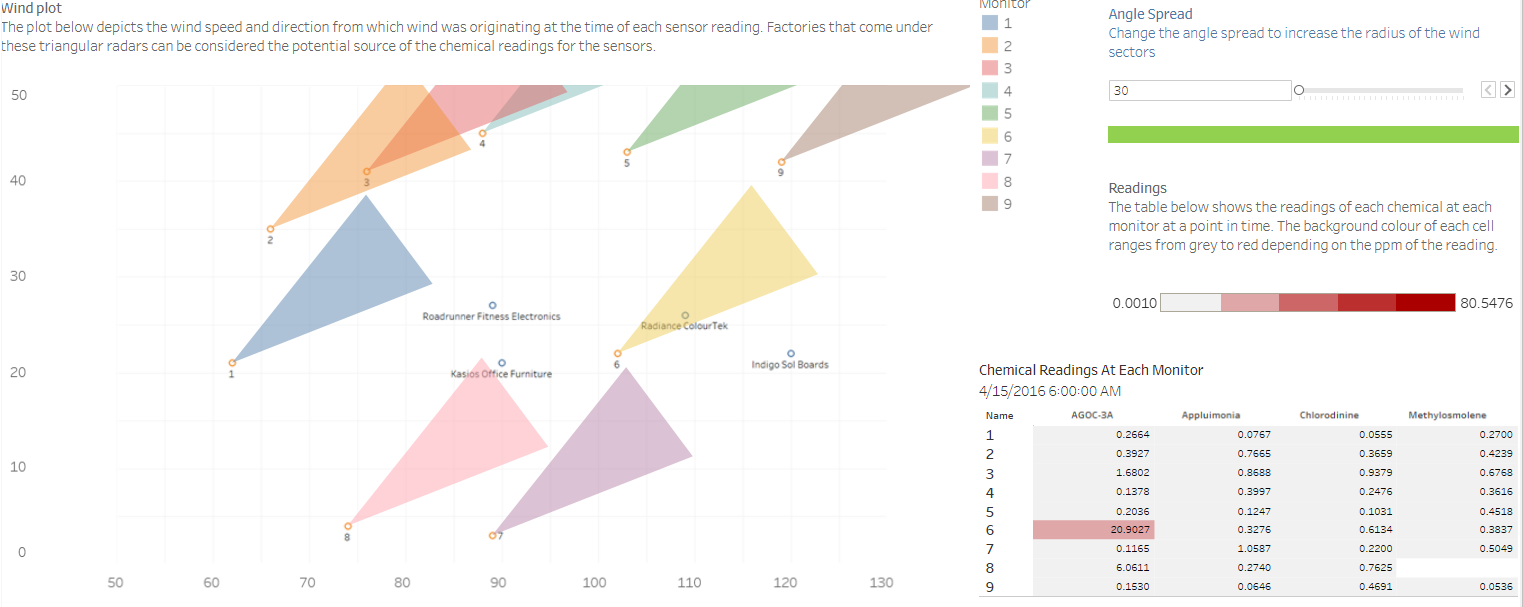
Another alternative way to view high readings is to use the time filter at the bottom of the page. By clicking the play button, the wind plot and the chemical readings tables reflect i) the wind direction and speed at the point in time and ii) the readings each sensor captures for each chemical at the point in time. When there is a high reading for a chemical, the reading is highlighted red. This reading can be hovered by users to highlight the relevant sensor’s wind plot.
As can be seen in the screenshot, on 15th April 5AM, there is a relatively high reading for AGOC-3A from sensor 6 (as seen in the “Chemical Readings at each Monitor” table). When the relevant sensor’s wind plot is seen, the triangle covers Radiance ColourTek, implying that it is the likely source for the AGOC-3A chemical.
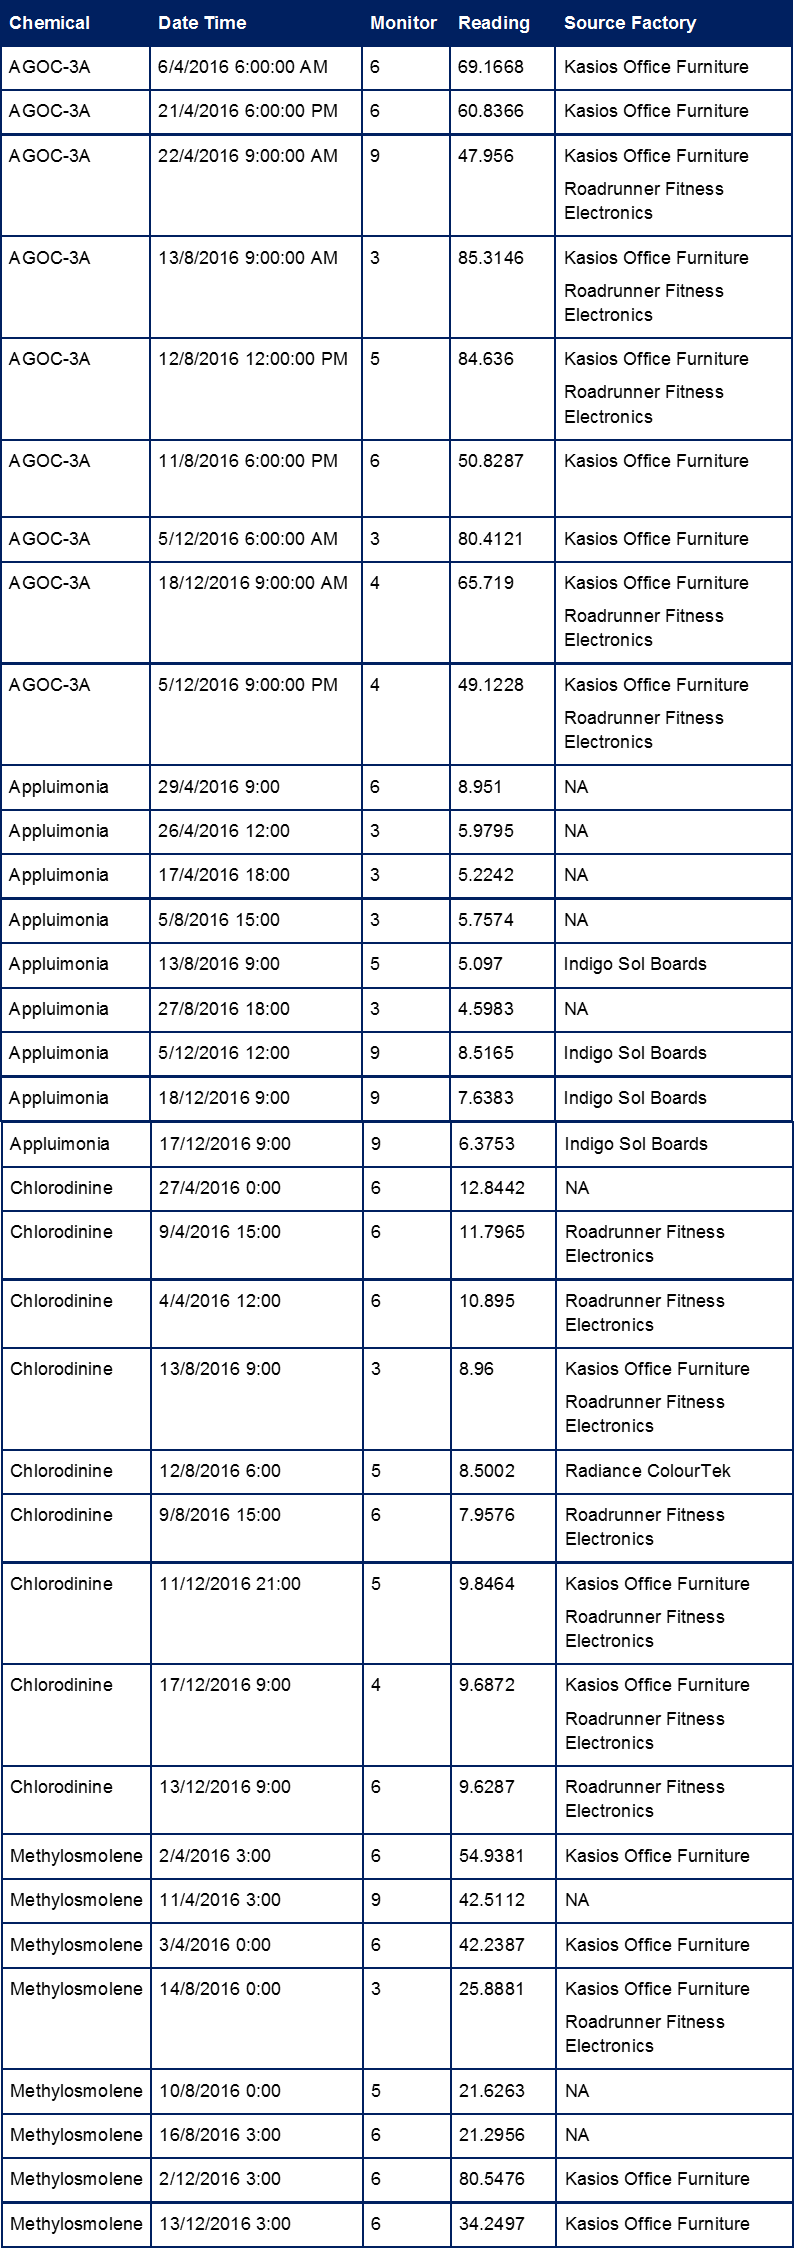
To identify the factories behind the chemicals, the first method of tracking the source for each of the high readings (“peaks”) of the chemicals across the month is used to find the following:
Summary of findings for Question 3
Based on the analysis:
- Kasios Office Furniture and Roadrunner Fitness Electronics contribute to the readings of AGOC-3A;
- Indigo Sol Boards is responsible for the release of Appluimonia;
- Kasios Office Furniture and Roadrunner Fitness Electronics are behind the release of Chlorodinine;
- Kasios Office Furniture and Roadrunner Fitness Electronics is the factory behind the high chemical readings of Methylosmolene.
As Chlorodinine and Methylosmolene are both hazardous chemicals that could be contributing to the reduction in population of the RBP, the two factories that release the chemicals should be investigated, i.e. Kasios Office Furniture and Roadrunner Fitness Electronics. Interestingly, both factories also potentially contribute to the high readings of AGOC-3A, the chemical which registered a higher number of readings on days where Methylosmolene registered a lower number of readings.


