ISSS608 2016-17 T3 Assign AKANGSHA BANDALKUL
Akangsha Bandalkul VAST Challenge - MC2
|
|
|
|
|
|
|
|
Overview
Mistford is a mid-size city in the southwest of a large nature preserve. It has an industrial area with four light-manufacturers: Roadrunner Fitness Electronics, Kasios Office Furniture, Radiance ColourTek and Indigo Sol Boards. The population of the Rose-Crested Blue Pipit (RBP), a popular local bird is decreasing.
The Pangera Ornithology Conservation Society is sponsoring studies to identify possible reasons. One such study is being conducted by Mitch Vogel, a post-doc student of ornithology at Mistford College. He has asked my help to identify whether the gases emitted by the four factories has contributed to the reducing population of the RBP. He is certain that these factories have had a hand in the downfall of the number of RBPs in Mistford.
Recently the factories have taken steps to make their processes more environmentally friendly. Nonetheless, the local Mistford government has been monitoring the gaseous effluents from the factories through a set of nine sensors that are placed around the factories.
The Four Factories
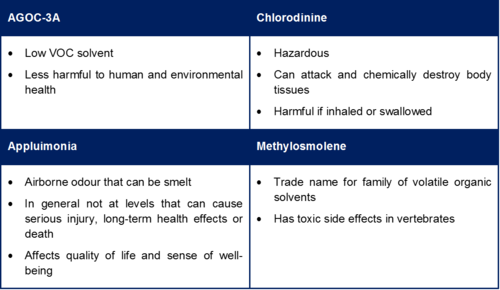
The Four Chemicals Tracked
The Key Questions
The primary goal is to determine which factory (if any) is contributing to the reduced population of the RBPs in Mistford.
To achieve this goal, the following questions are identified:
- Question 1: Characterize the sensors’ performance and operation. Are they all working properly at all times? Can you detect any unexpected behaviours of the sensors through analysing the readings they capture?
- Question 2: Now turn your attention to the chemicals themselves. Which chemicals are being detected by the sensor group? What patterns of chemical releases do you see, as being reported in the data?
- Question 3: Which factories are responsible for which chemical releases? Carefully describe how you determined this using all the data you have available. For the factories you identified, describe any observed patterns of operation revealed in the data.

