ISSS608 2016-17 T3 Assign AKANGSHA BANDALKUL Data Available
Akangsha Bandalkul VAST Challenge - MC2
|
|
|
|
|
|
|
|
Data Available
The following data sets are provided by Mitch for my analysis:
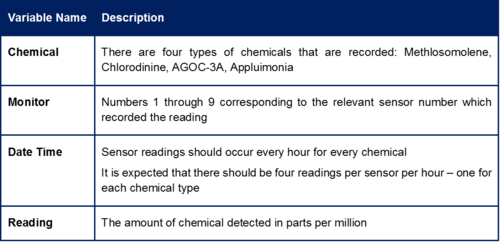
- Air sampler data
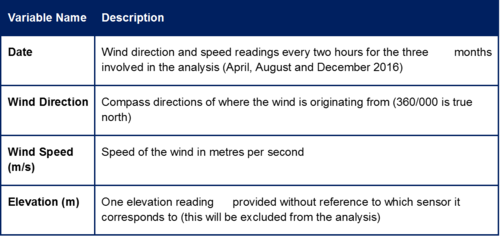
- Meteorological data
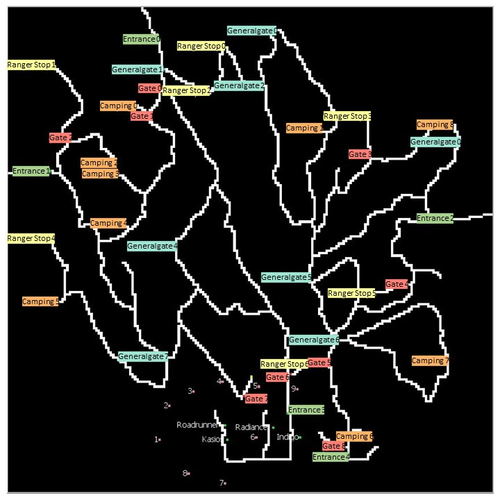
- A map of locations in Mistford
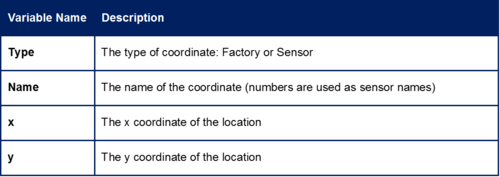
I also have a list of coordinates corresponding to the factories and sensor locations that correspond to the locations on the map of Mistford.
The data provided for the sensor and meteorological data cover the three months of April, August and December 2016.
Air Sampler Data
Meteorological Data
Nature Reserve Map
Locations Data Table
An image of a map is provided which shows the locations of the factories and the sensors in the nature reserves.
Based on the coordinate details provided in the VAST challenge background information, a new data set named “Locations Data.csv” is created to be used as reference for the analysis:
Please note that for each of the questions answered as part of the VAST competition, screenshots have been prepared to display all months in one view. On the interactive dashboard, these visualisations are filtered by month for an improved visualization experience.


