ISSS608 2016-17 T3 Assign AKANGSHA BANDALKUL Q1
Akangsha Bandalkul VAST Challenge - MC2
|
|
|
|
|
|
|
|
Overview
Characterize the sensors’ performance and operation. Are they all working properly at all times? Can you detect any unexpected behaviours of the sensors through analysing the readings they capture?
Background Information
Overview of the sensor data set – part I
When approaching this question, the first step done is to understand the distributions of the sensor dataset provided. This is done through JMP.
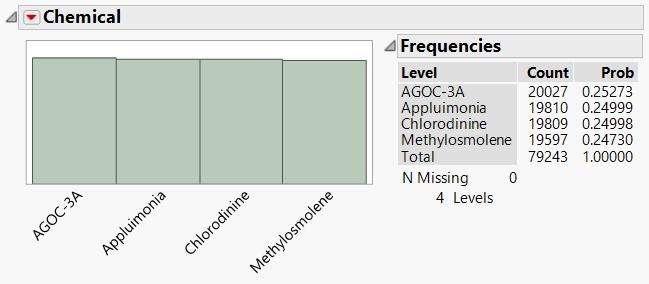
Chemical
- As expected we see that all readings correspond to four chemicals;
- Readings are relatively equally distributed between the four with approximately 25% proportion of readings each;
- There is a higher number of readings of AGOC-3A (one of the least harmful chemicals);
- There is a lower number of readings of Methylosmolene (one of the most harmful chemical);
- There are no missing values for this column.
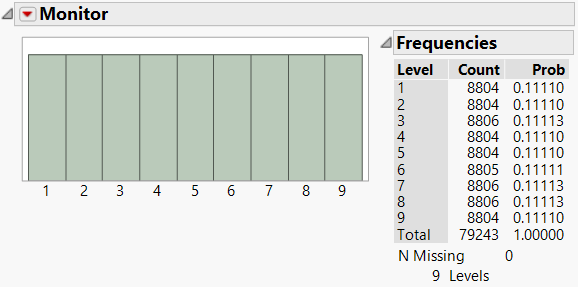
Monitor
- The numbers correspond to the sensor numbers;
- 9 sensors as expected based on the background information provided on the case;
- It is interesting to note that there are a lower number of readings for sensors 1, 2, 6, and 9;
- There are no missing values for this column.
Date Time
- Readings start from 1st April 2016 12:00AM till 31st December 2016 11:00PM;
- There are three major peaks – corresponding to the three months for which data is provided;
- There are no missing values for this column.
Data Cleaning
There were no data cleaning steps performed on the Sensor Data for this question.
VAST Answer
Overview of Daily Readings
On average, for each of day we expect to see 96 readings for each monitor – four readings every hour for each of the chemicals.
Key findings As can be seen, each month, on the same days there are fewer readings recorded for every sensor:
- In April, the 2nd and 6th days of the months have 4 fewer readings;
- In August, the 2nd, 4th and 7th days of the months have 2 – 4 fewer readings;
- In December, the 2nd and 7th days of the month have 2 – 4 fewer readings.
Because of the consistency in the reduced number of readings seen across most the sensors, it is possible that these dates correspond to maintenance dates for the sensors. However, if this was the case, the same dates or days would be set as maintenance days across all months. From the visualization, only the 2nd is the consistent date across all months.
It is also strange for there to be multiple maintenance dates in a month that are close to each other. This would require further investigation and cross checking with the government agency that controls the sensors.
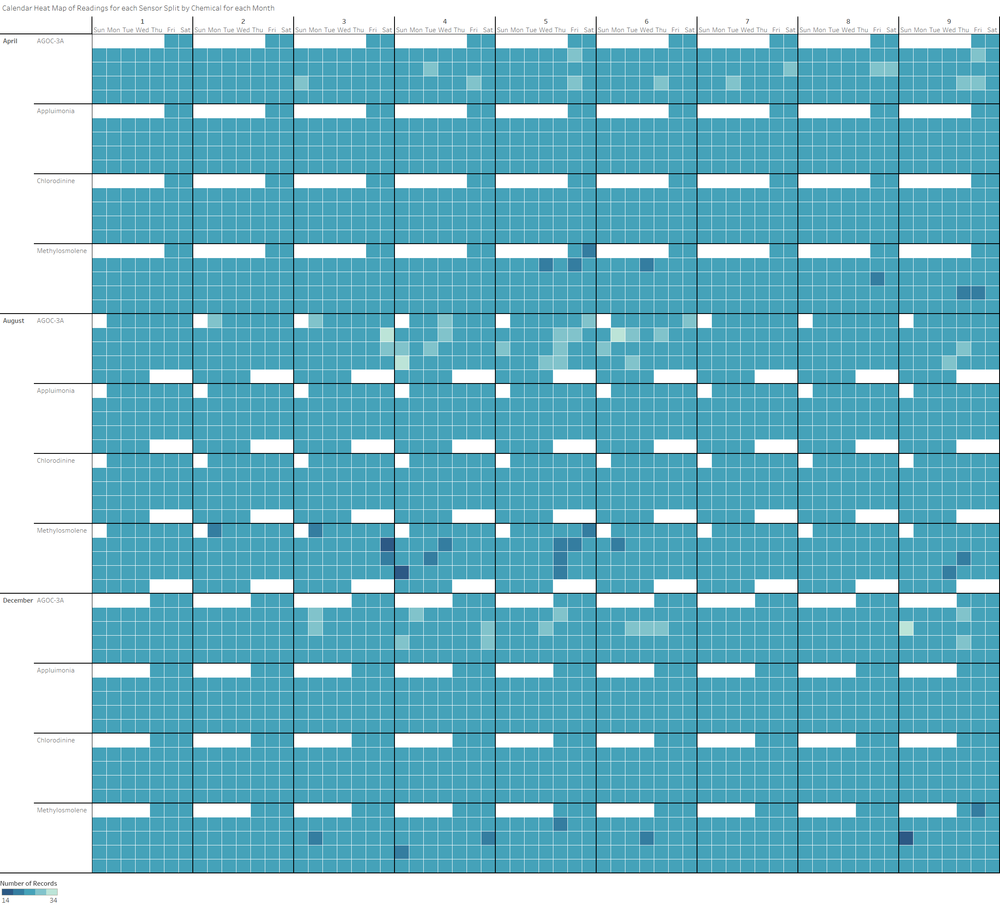
Daily Readings for each Chemical each Month
It is expected that for chemical there would be 24 readings recorded each day by each monitor, one reading for each chemical per hour.
Key findings If we look further into the number of readings broken down by each chemical, the discrepancies in readings span more days than seen in the initial plot:
- Sensor 1 behaves as expected each month, recording 24 readings for each chemical each day;
- Sensors 3, 4, 5, 6, and 9 seem to have the most erratic behavior in sensor readings – mostly seen for the recording of AGOC-3A (least harmful) and Methylosmolene (the most harmful);
- Interestingly, there are many instances where there were additional readings seen for AGOC-3A on the same days where there were a lower number of readings for Methylosmolene (as seen by sensor 2 on August 2nd) though they cannot all be exactly mapped to show this relationship;
- Readings for Appluimonia and Chlorodinine were always captured as expected by every monitor.
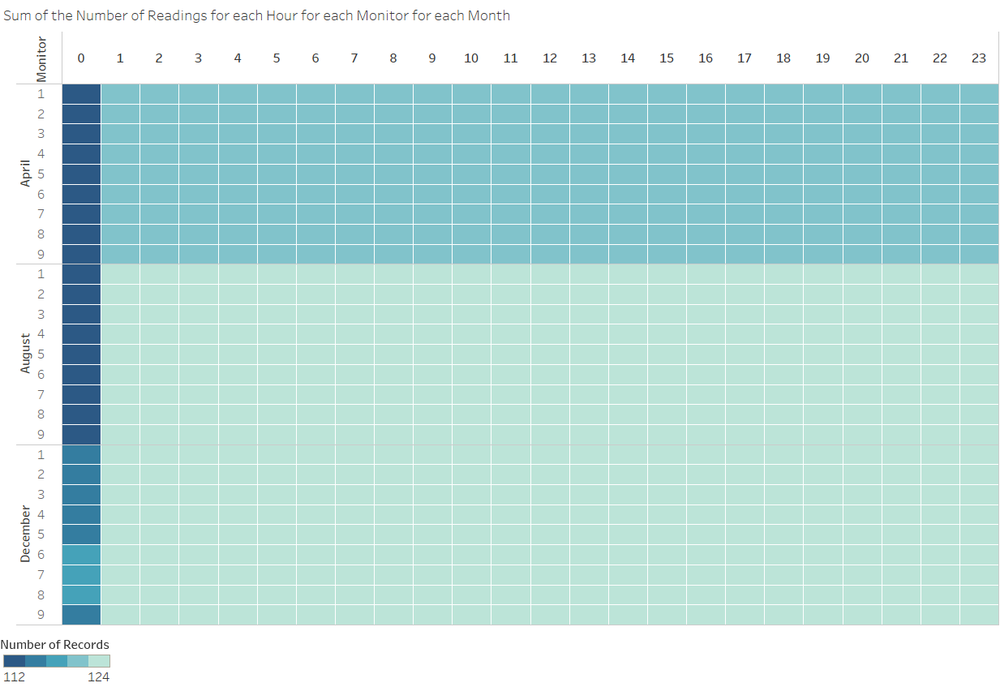
Overview of Number of Hourly Readings for Each Month
On average, each hour we expect there to be the same number of readings: for each monitor, we expect there to be four readings corresponding to each of the four chemicals being tracked. Over the span of the month, this would mean that there would be:
- 120 readings for each of the 24 hours in the day for April;
- 124 readings for each of the 24 hours of the day for August and December.
Key findings As can be seen from the plot, the only time the number of readings is different from the expected number of readings is the reading which occurs at midnight.
This could be due to some maintenance issue – but since the decrease in readings isn’t seen every day or seen on the same days each month based on the previous plot, this needs to be further investigated.
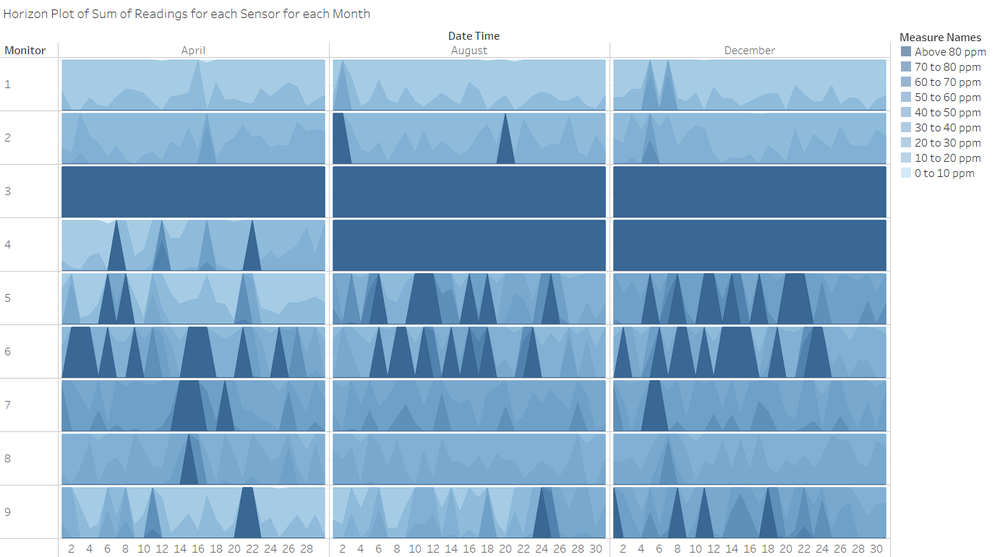
Horizon Plot of Sum of Readings
The next step is to understand the values of the readings captured by each of the sensors over the month.
Key findings
- By looking at the horizon plot of sum of readings over each of the three months it is immediately evident that monitors 3 and 4 read the highest values of chemicals across the months – sensor 3 captures high readings everyday while sensor 4 captured high readings daily in August and December;
- These are followed by monitors 5, 6 and 7. Monitors 1, 2, and 8 tend to capture lower chemical readings.
Summary of findings for Question 1
- As seen from the plots, the sensors do not behave as expected at all times;
- For 2 – 3 days for the first week of each month, there is a lower number of readings than expected;
- Monitors 3, 4, 5, 6 and 7 usually see the highest chemical readings;
- Further drill down has helped identify that these lower number of readings only occur at midnight;
- It is also interesting to note that days where there are lower number of readings for Methylosmolene were also days where there were a higher number of readings than expected for AGOC-3A;
- The tradeoff between the lower number of readings for one chemical and the higher number of readings for another means that this discrepancy would not be caught without drilling down into the readings for chemical each month;
- If the lower number of readings was seen consistently on the same day of each week/date of each month or across all chemicals, it could be concluded that this follows the pattern of a scheduled maintenance period, however, the fact that the discrepancies in readings are seen only for 2 chemicals implies that there is more to the story.
