From Visual Analytics and Applications
Jump to navigation
Jump to search
Yunna Wei - ISSS608 Visual Analytics and Applications_Assignment1
Multiple Days Pattern
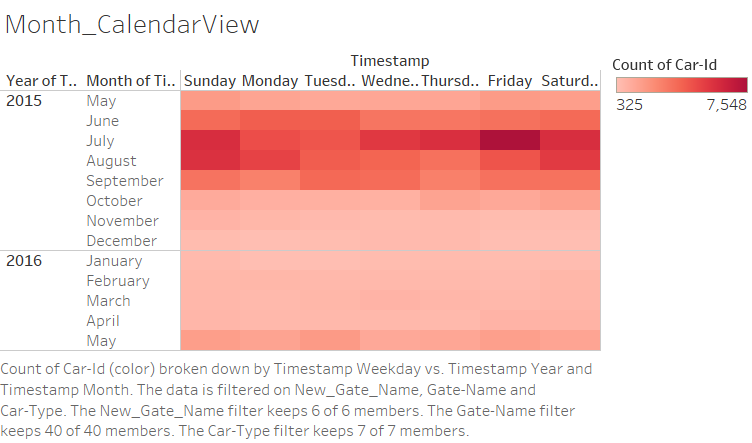
Calendar View by Month
|
the left diagram well demonstrates that there are peak and off-peak periods in terms of traffic flow in the nature reserve. It is clear that there are much more traffic during months of June, July and August and the traffic load dropped significantly after September. What's more interesting is there is almost no traffic in months of December,January and February. This trend is more true for car types of 1(2 axle car (or motorcycle)), 2(2 axle truck) and 3(3. 3 axle truck) |
Quarterly Pattern
|
|
|
|
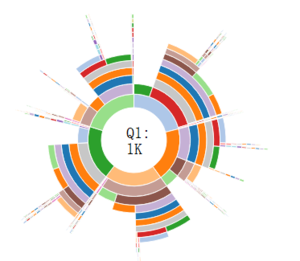
Q1 Pattern: Q1 is the least popular season as the traffic only takes up 5.6% of the overall traffic. The routes in Q1 are quite short and a relative big portion of the traffic has routes of from one entrance to another entrance directly or only going through one gate, which can be assumed that these car ids are just using as the preserve as a convenient transportation option, in stead of actually visiting the preserve. In Q1, the traffic focuses on:
- Entrance4--Generalgate5--Generalgate2--Rangerstop0--Rangerstop2--Generalgate1
- Entrance1--Generalgate7--Generalgate4
- Entrance3--Generalgate1--Rangerstop2--Rangerstop0
- Entrance2--Generalgate2--Rangerstop0--Rangerstop2
- Entrance0--Generalgate1--Rangerstop2--Rangerstop0
|
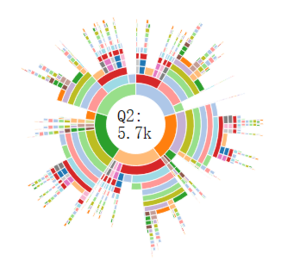
Q2 Pattern: Q2 |
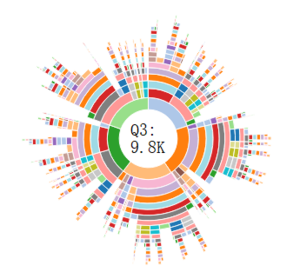
Q3: |
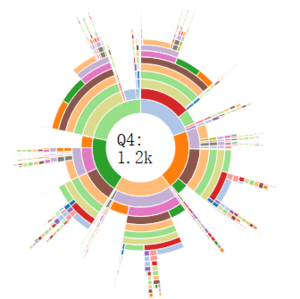
Q4: |
