From Visual Analytics and Applications
Jump to navigation
Jump to search
Yunna Wei - ISSS608 Visual Analytics and Applications_Assignment1
Data Preparation
The given data sets are respectively a map and a csv file.
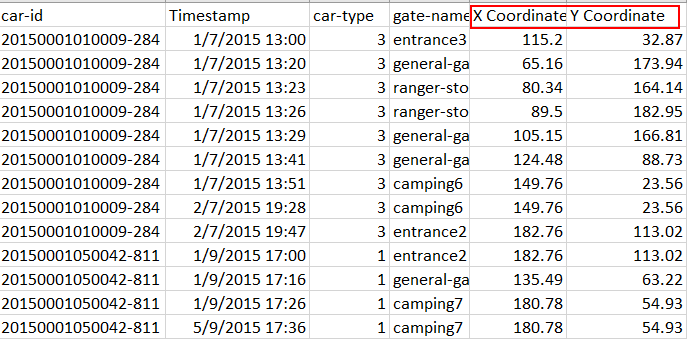
Mapping the coordinates of each location
| For the map, it will be useful to get the coordinates of each location so that we can plot the map with traffic going through to gave a whole picture of how the traffic looks like. Tableau is used to manually label the coordinates of each location. The locations are mapped within a 200x200 scale. |
|
Creating new variables
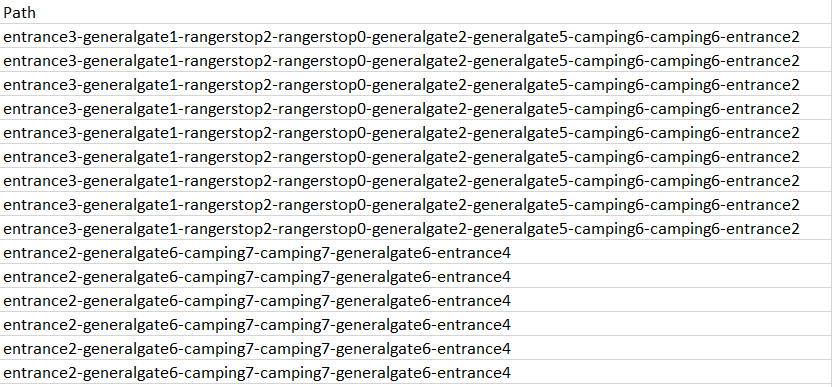
Travelling Path
| The given csv data set has the variables of Car_id, timestamp,car-type, and gate name. To find out more information about the traffic patterns, new variables should be created based on the given variables. |
|
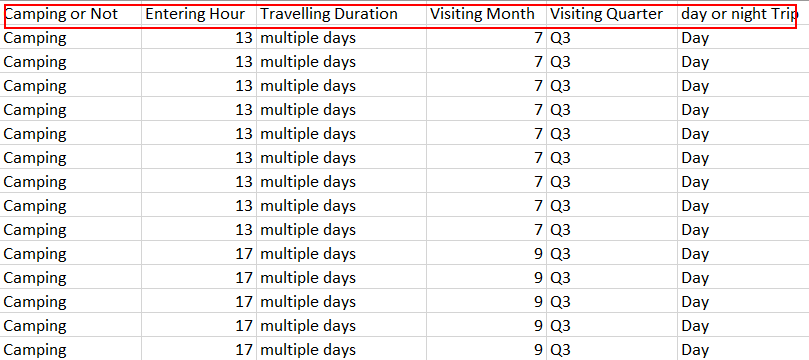
Other Variables
- Camping or Not: Organizing the activities of visitors into camping or Noncamping.
- Travelling Duration: Calculate the travelling duration of each car id and categorize them into travelers whose duration is within one day and travelers whose duration is more than one day.
- Visiting month: Calculate the visiting month of each car id.
- Visiting quarter: Calculate the visiting quarter of each car id.
- Entering hour: Calculate the entering hour of each car id.
- Day or Night Trip: Based on the entering hour, categorize the traffic into day or night traffic.
|
|


