ISSS608 2016-17 T3 Assign CHEN YINJUE Data Analytics
Revision as of 01:30, 6 July 2017 by Yinjue.chen.2016 (talk | contribs)
|
|
|
|
|
|
Data Visualization & Insights
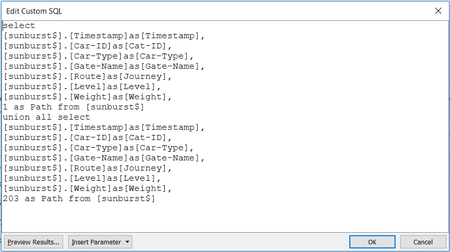
After data preparation, now it's time to draw sunburst chart in tableau. Firstly, open tableau, under ‘Connect’ click ‘Excel’ and then select the Excel file we prepared before. Noted that we should choose ‘open with legacy connection’ in this step so that custom SQL can be used later. Secondly, drag ‘New Custom SQL’ to the area with ‘Drag tables here’ and apply SQL code as below:

