ISSS608 2016-17 T3 Assign AKANGSHA BANDALKUL Q2
Akangsha Bandalkul VAST Challenge - MC2
|
|
|
|
|
|
|
|
Question: Now turn your attention to the chemicals themselves. Which chemicals are being detected by the sensor group? What patterns of chemical releases do you see, as being reported in the data?
Please note that you can see full details on the data and worksheet preparation steps on this page.
Background Information
Overview of the sensor data set – part II
When approaching this question, the first step done is to understand the distributions of the chemical readings in the sensor dataset provided. This is done through JMP.
Reading
- Readings are mostly low with 99.5% of the readings below 6.46 ppm, as seen by the peak at the start of the graph;
- There are however many readings with high ppm.
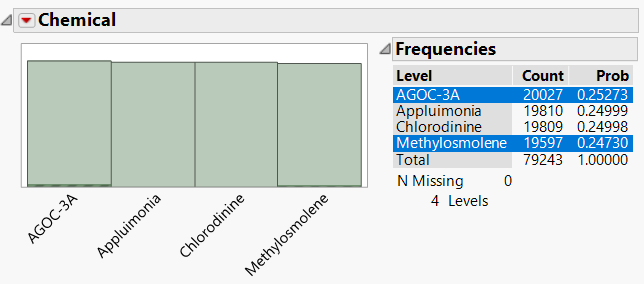
To understand if there are any insights that can be derived from these high readings, readings with ppm above 20ppm (approx.) are highlighted. It is interesting to note that the following changes are seen in the Chemical graph:
All readings selected due to high ppm correspond to two chemicals:
- AGOC-3A: the low VOC- solvent less harmful to human and environmental health;
- Methylosmolene: the chemical with toxic side effects in vertebrates.
Data Cleaning
There were no data cleaning steps performed on the Sensor Data for this question.
VAST Answer
Dot Plot of Chemical Readings by Hour (overall)
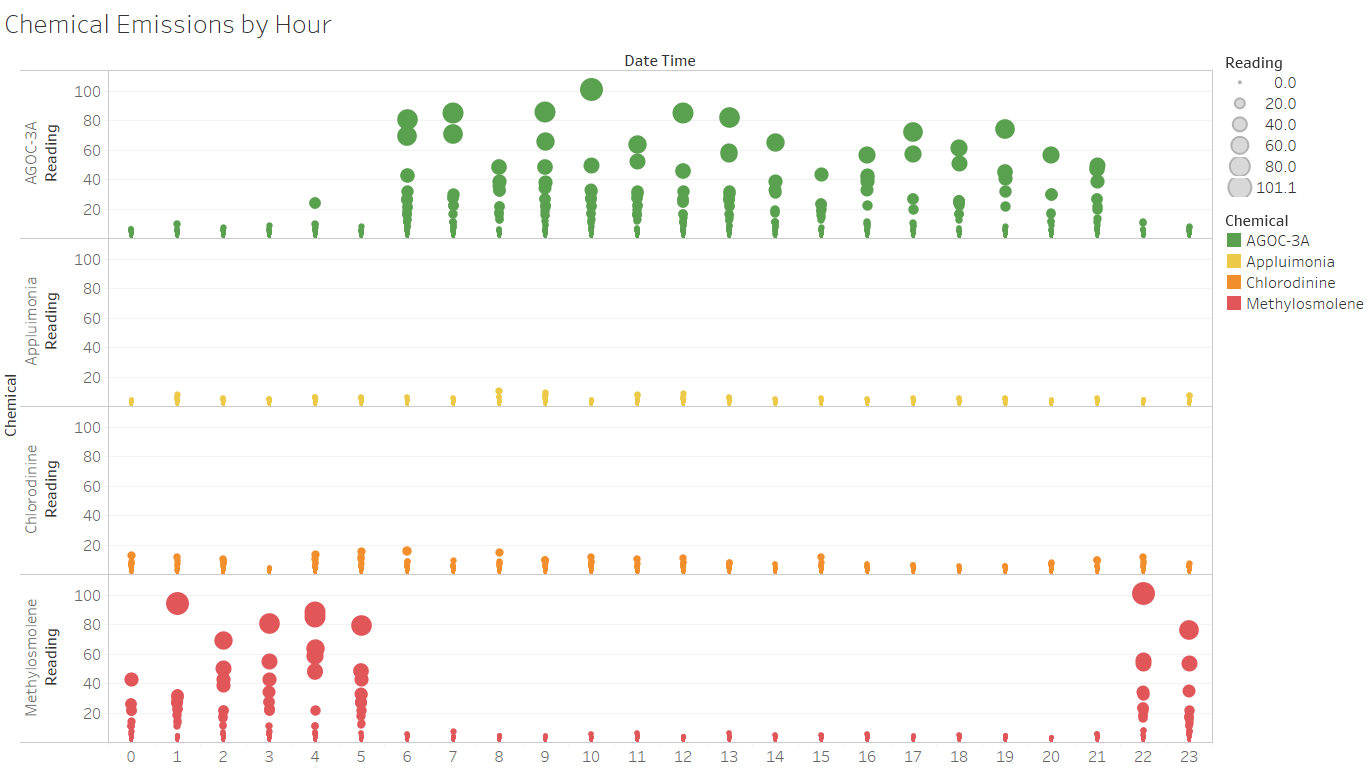
Next, we see if there are any trends in the hours in which high readings occur for each of the four chemicals using dot plots.
Key findings
- If we look at the hourly emissions of readings across the three months, it is immediately evident that Methylosmolene and AGOC-3A have different emission schedules and reading levels compared to the other two chemicals;
- While both chemicals have had high readings registered by the sensors, Methylosmolene only seems to have high readings registered between 10PM and 5AM while AGOC-3A has high readings registered between 6AM and 9PM. Emissions of AGOC-3A are not harmful whereas Methlosmolene is hazardous to all vertebrates, making these high emissions a cause for concern;
- Chlorodine which also has readings registered which is another cause for concern. Though the readings may not be as high as the readings for Methylosmolene, the existence of such chemical is harmful to vertebrates and could be impacting the environment.
Hourly Readings for each Chemical each Month
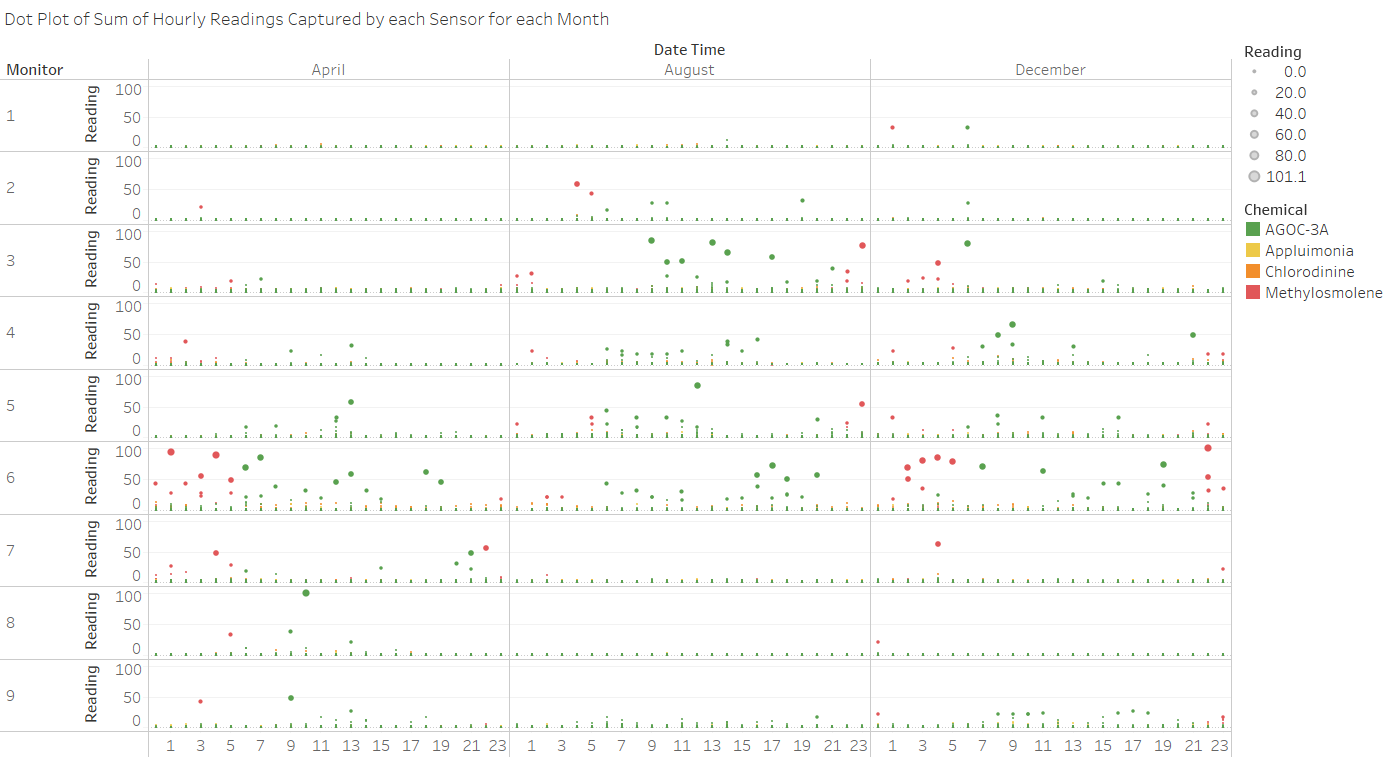
If we take the previous dot plot one step further, we can see whether the trend for the timing of high emissions is the same across the three months.
Key findings from
- Sensors 8 and 9 have more records of high readings in April than in the months to follow;
- It is interesting to note that the high readings of Methylosmolene in the middle of the night are mostly captured by sensor 6 while the high readings of AGOC-3A seem to be spread across sensors 3 to 9;
- The same trend of Methylosmolene having high emissions during the night and AGOC-3A during the day is seen across all three months.
Dot Plot of Chemical Emissions by Day of the Month
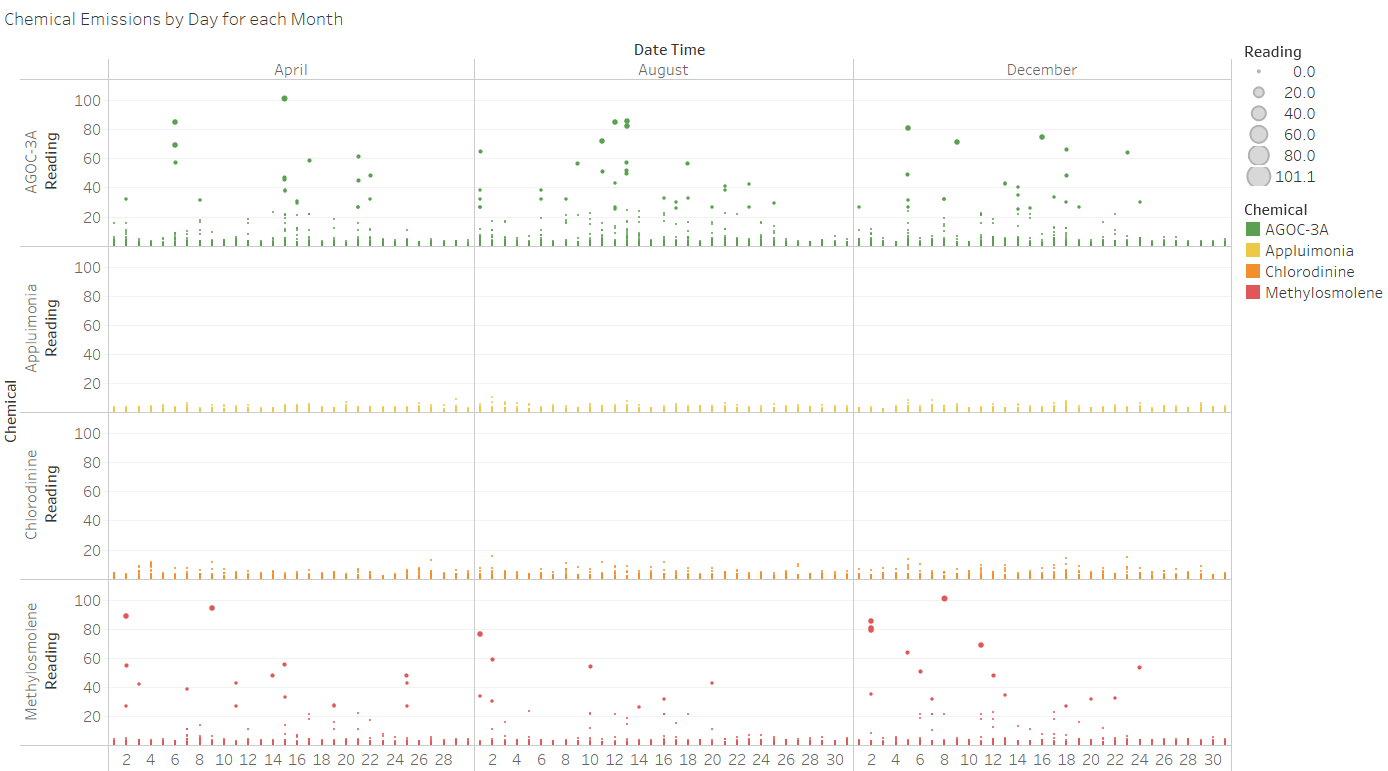
Further to the dot plot analysis of hourly trends seen in the release of chemicals, we can also do a dot plot to see if there are any trends in the release of chemicals during each month.
Key findings
- Looking at the pattern of emissions across the days of each month it can be seen that the high readings of AGOC-3A and Methylosmolene both reduce in the last few days of each month;
- Readings for Appluimonia and Chlorodinine stay relatively consistent throughout the days of the month.
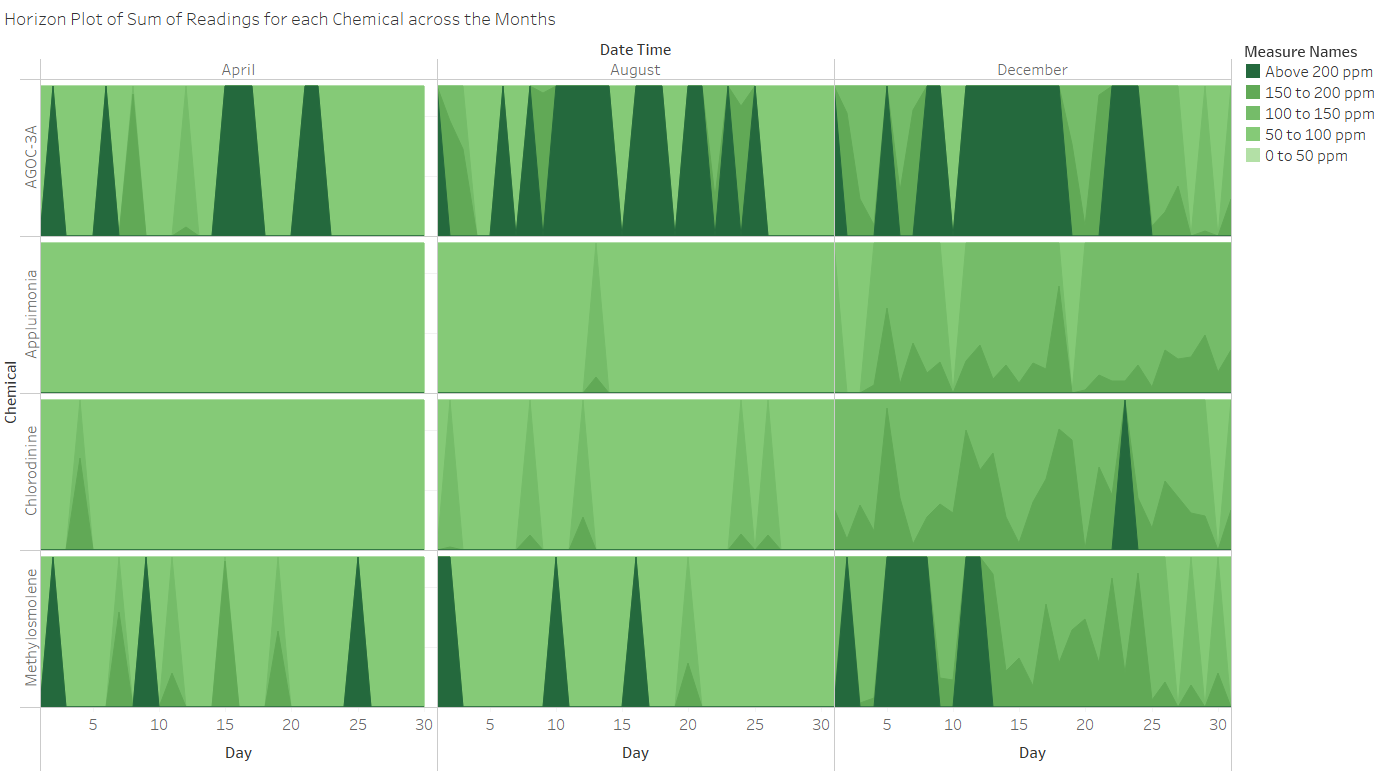
Horizon Plot for Each Chemical
Further to the analysis above, a horizon plot for each of the chemicals will allow the readings to be further understood over the span of the month. The sum of readings across the days of the month are calculated.
Key findings
- There are higher readings overall seen in December compared the previous two months for all chemicals;
- AGOC-3A has the highest readings registered across the months, followed by Methylosmolene;
- High readings for all chemicals are registered earlier in the month;
- Chlorodinine has relatively high readings appearing in August as well which is concerning as this is also a hazardous chemical.
Summary of findings for Question 2
- AGOC-3A and Methylosmolene have the highest readings registered from the four chemicals;
- There are higher readings registered in Deember than the previous two months;
- Methylosmolene tends to have high chemical readings appearing between 10PM and 5AM;
- AGOC-3A tends to have high chemical reading appearing between 6AM and 9PM;
- The last few days of each month only mostly have low readings registered across all three months.


