Difference between revisions of "S-MALL Future Work"
Jump to navigation
Jump to search
Ycchen.2016 (talk | contribs) |
Ycchen.2016 (talk | contribs) |
||
| Line 23: | Line 23: | ||
| | | | ||
|} | |} | ||
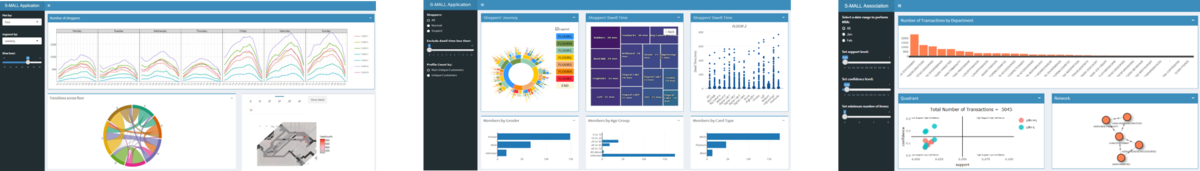
| + | == APPLICATION == | ||
| + | <table width=100%> | ||
| + | <tr> | ||
| + | <td align="center"><font size = 2><span style="font-family:Century Gothic;"><b>[https://smartcafe.shinyapps.io/s-mall1-movement_analysis/ Movement Analysis]</b></span></font></td> | ||
| + | <td align="center"><font size = 2><span style="font-family:Century Gothic;"><b>[https://smartcafe.shinyapps.io/s-mall2-members_analysis/ Member Analysis]</b></span></font></td> | ||
| + | <td align="center"><font size = 2><span style="font-family:Century Gothic;"><b>[https://smartcafe.shinyapps.io/s-mall3-association_rules/ Association Analysis]</b></span></font></td> | ||
| + | </tr> | ||
| + | </table> | ||
| + | [[File:T3 Appoverview.png|center|1200px]] | ||
| − | + | == GUIDE == | |
| − | |||
Part1: Movement Analysis | Part1: Movement Analysis | ||
{| class="wikitable" | {| class="wikitable" | ||
| Line 128: | Line 136: | ||
|- | |- | ||
! scope="row" style="background: #ffffff;"| | ! scope="row" style="background: #ffffff;"| | ||
| − | [[File:T3 | + | [[File:T3 Part3 control.PNG|center|200px]] |
| + | | | ||
| + | <ul> | ||
| + | <li>Set date range using radio button to see the plot of different months.</li> | ||
| + | <li>Set parameters (support/confidence/min items) to generate valid associations rules and render plot forquadrant and network. </li> | ||
| + | </ul> | ||
| + | |- | ||
| + | ! scope="row" style="background: #ffffff;"| | ||
| + | [[File:T3 Part3 bar.PNG|center|300px]] | ||
| | | | ||
<ul> | <ul> | ||
| − | <li></li> | + | <li>Investigate popular shopping path of members based on floors.</li> |
| − | <li> | + | <li>Hover over the bar to fade out non-relevant rules in the quadrant as following.</li> |
| − | |||
| − | |||
| − | |||
</ul> | </ul> | ||
|- | |- | ||
! scope="row" style="background: #ffffff;"| | ! scope="row" style="background: #ffffff;"| | ||
| − | [[File:T3 | + | [[File:T3 Part3 node.PNG|center|200px]] |
| | | | ||
<ul> | <ul> | ||
| − | <li></li> | + | <li>Visualize the associations among departments.</li> |
| − | <li></li> | + | <li>Hover over the network to fade out non-relevant rules in the quadrant as following.</li> |
</ul> | </ul> | ||
|- | |- | ||
! scope="row" style="background: #ffffff;"| | ! scope="row" style="background: #ffffff;"| | ||
| − | [[File:T3 | + | [[File:T3 Part3 qua.PNG|center|300px]] |
| | | | ||
<ul> | <ul> | ||
| − | <li> | + | <li>Analyze the competitive position of different rules based on set parameters.</li> |
| − | |||
</ul> | </ul> | ||
|- | |- | ||
! scope="row" style="background: #ffffff;"| | ! scope="row" style="background: #ffffff;"| | ||
| − | [[File: | + | [[File:Part3 table.PNG|center|300px]] |
| | | | ||
<ul> | <ul> | ||
| − | <li></li> | + | <li>Detail information of different rules based on set parameters.</li> |
</ul> | </ul> | ||
|- | |- | ||
|} | |} | ||
| + | |||
| + | Please be patient. | ||
Revision as of 14:56, 6 August 2017
Turning Concrete Malls into Smart Malls (S-MALL):
A web-based analytics application for visualizing and mapping in-mall customer journeys and shopping behaviours
Team S-MALL: Chen Yun-Chen | Chiam Zhan Peng | Zheng Bijun
|
|
|
|
|
APPLICATION
| Movement Analysis | Member Analysis | Association Analysis |

GUIDE
Part1: Movement Analysis
| Screenshot | Guidance |
|---|---|
 |
|
 |
|
 |
|
 |
|
 |
|
Part2: Member Analysis
| Screenshot | Guidance |
|---|---|
 |
|
 |
|
 |
|
 |
|
|
|
|
Part3: Association Analysis
| Screenshot | Guidance |
|---|---|
 |
|
 |
|
 |
|
 |
|
 |
|
Please be patient.