From Visual Analytics and Applications
Jump to navigation
Jump to search
Turning Concrete Malls into Smart Malls (S-MALL):
A web-based analytics application for visualizing and mapping in-mall customer journeys and shopping behaviours
Team S-MALL: Chen Yun-Chen | Chiam Zhan Peng | Zheng Bijun
APPLICATION
USER GUIDE
Part1: Movement Analysis
| Screenshot
|
Guidance
|
|
|
- "Plot by" and "Segment by" dropdown are used for line chart. Select "Segment by" will show cycle plot accordingly.
- "View" and "View hour" dropdown are for selecting date and hour respectively and display the inter-flow movement and hexbin map for that selected date and hour.
|
|
|
- Hover on any points on the line chart to display the tooltip for detailed information.
|
|
|
- Hover on the chorddiagram to display the tooltip for detailed information.
- Example: There are 61 customers moving from 3F to 2F and 57 customers moving from 2F to 3F at selected time.
|
|
|
- Zoom in by selecting area with left click hold and release as required and click on any hexbin for the selected hexbin to be captured.
- Click on "Show Detail" button to show the distribution of the selected hexbin. Members and Non-members count will be displayed.
|
Error creating thumbnail: File with dimensions greater than 12.5 MP |
- Click on the bar chart to show detailed information such as their Device ID and number of counts.
|
|
|
- Count means the customer stays in selected hexbin for how long (min) in selected time interval.
|
Part2: Member Analysis
| Screenshot
|
Guidance
|
|
|
- Selection All in Operating Hours: All members
- Selection Normal in Operating Hours: Members who only appear in operating hours.
- Selection Outside in Operating Hours: Members who appear out of operating hours.
- Exclude dwell time less then: This control panel is for Shopper's Journey. User can exclude those records which only stay in a particular floor for a few minutes.
- Profile Count by: This control panel is for member distribution. Non-Unique Customers: Count by records. Unique Customers: Count by member ID.
|
|
|
- Hover to see the path and relevant statistics.
- Example: There are 23 of 2.2k journeys which start from FLOOR M and go to FLOOR G then go to FLOOR 2.
|
|
|
- Click on floor level to drill down to store level.
- Click on any store to show the relevant boxplot for selected floor as following.
|
|
|
- Select records you are interested in to show the relevant distribution(bar chart) as following.
|
|
|
- Get the distribution of records in box selection.
|
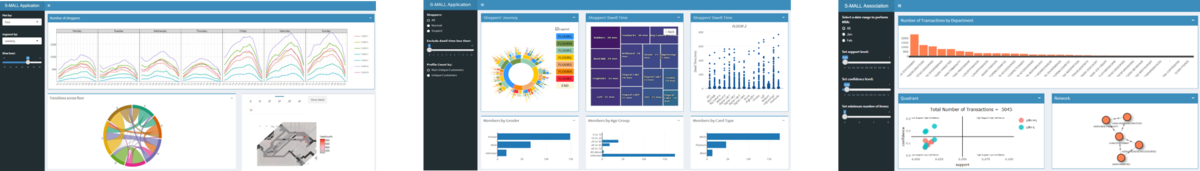
Part3: Association Analysis
| Screenshot
|
Guidance
|
|
|
- Set date range using radio button to see the plot of different months.
- Set parameters (support/confidence/min items) to generate valid associations rules and render plot forquadrant and network.
|
|
|
- Investigate popular shopping path of members based on floors.
- Hover over the bar to fade out non-relevant rules in the quadrant as following.
|
|
|
- Visualize the associations among departments.
- Hover over the network to fade out non-relevant rules in the quadrant as following.
|
|
|
- Analyze the competitive position of different rules based on set parameters.
|
|
|
- Detail information of different rules based on set parameters.
|
Please be patient.