Difference between revisions of "S-MALL Future Work"

From Visual Analytics and Applications
Jump to navigation Jump to search
Line 19: Line 19:
 
| style="font-family:Century Gothic; font-size:100%; solid #1B338F; background:#2e5b84; text-align:center;" width="25%" |   
 
| style="font-family:Century Gothic; font-size:100%; solid #1B338F; background:#2e5b84; text-align:center;" width="25%" |   
 
;  
 
;  
[[S-MALL_User Guide| <font color="#FFFFFF">User Guide</font>]]  
+
[[S-MALL_Future Work| <font color="#FFFFFF">User Guide</font>]]  


|  &nbsp;  
 
|  &nbsp;  

Revision as of 14:16, 6 August 2017

Turning Concrete Malls into Smart Malls (S-MALL):
A web-based analytics application for visualizing and mapping in-mall customer journeys and shopping behaviours

Team S-MALL: Chen Yun-Chen | Chiam Zhan Peng | Zheng Bijun

Overview

Application

Poster

User Guide


Part1: Movement Analysis

Screenshot Guidance
T3 Part2 control.PNG
T3 Part2 sunburst.PNG
T3 Part2 treemap.PNG
T3 Part2 boxplot.PNG
T3 demobar.JPG


Part2: Member Analysis

Screenshot Guidance
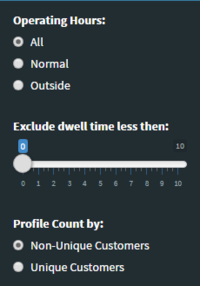
T3 Part2 control.PNG
  • Selection All in Operating Hours: All members
  • Selection Normal in Operating Hours: Members who only appear in operating hours.
  • Selection Outside in Operating Hours: Members who appear out of operating hours.
  • Exclude dwell time less then: This control panel is for Shopper's Journey. User can exclude those records which only stay in a particular floor for a few minutes.
  • Profile Count by: This control panel is for member distribution. Non-Unique Customers: Count by records. Unique Customers: Count by member ID.
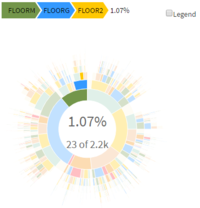
T3 Part2 sunburst.PNG
  • Hover to see the path and relevant statistics.
  • Example: There are 23 of 2.2k journeys which start from FLOOR M and go to FLOOR G then go to FLOOR 2.
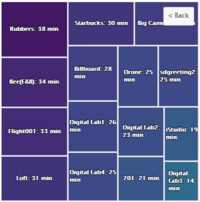
T3 Part2 treemap.PNG
  • Click on floor level to drill down to store level.
  • Click on any store to show the relevant boxplot for selected floor as following.
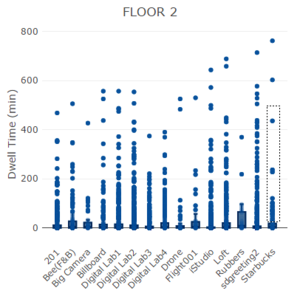
T3 Part2 boxplot.PNG
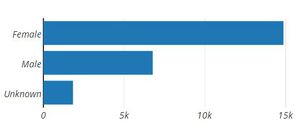
  • Select records you are interested in to show the relevant distribution(bar chart) as following.
T3 demobar.JPG
  • Get the distribution of records in box selection.

Part3: Association Analysis

Screenshot Guidance
T3 Part2 control.PNG
T3 Part2 sunburst.PNG
T3 Part2 treemap.PNG
T3 Part2 boxplot.PNG