Difference between revisions of "YunnaWei DataPreparation"
Jump to navigation
Jump to search
| Line 1: | Line 1: | ||
| + | <div style="background:#002060; border:#002060; padding-left:15px; text-align:center;"> | ||
| + | <font size = 5; color="#FFFFFF"><span style="font-family:Century Gothic;">Yunna Wei - ISSS608 Visual Analytics and Applications_Assignment1</span></font> | ||
| + | </div> | ||
| + | <!--MAIN HEADER --> | ||
| + | {|style="background-color:#FFE79E;" width="100%" cellspacing="0" cellpadding="0" valign="top" border="0" | | ||
| + | | style="font-family:Century Gothic; font-size:100%; solid #000000; background:#C00000; text-align:center;" width="20%" | | ||
| + | ; | ||
| + | [[ISSS608 2016-17 T3 Assign WEI YUNNA| <font color="#FFFFFF">Introduction</font>]] | ||
| + | |||
| + | | style="font-family:Century Gothic; font-size:100%; solid #1B338F; background:#002060; text-align:center;" width="20%" | | ||
| + | ; | ||
| + | [[YunnaWei_DataPreparation| <font color="#FFFFFF">Data Preparation</font>]] | ||
| + | |||
| + | | style="font-family:Century Gothic; font-size:100%; solid #1B338F; background:#002060; text-align:center;" width="20%" | | ||
| + | ; | ||
| + | [[YunnaWei_OverviewExploration| <font color="#FFFFFF">Overview Exploration</font>]] | ||
| + | |||
| + | | style="font-family:Century Gothic; font-size:100%; solid #1B338F; background:#002060; text-align:center;" width="20%" | | ||
| + | ; | ||
| + | [[YunnaWei_PatternDetection| <font color="#FFFFFF">Pattern Detectoin</font>]] | ||
| + | |||
| + | | style="font-family:Century Gothic; font-size:100%; solid #1B338F; background:#002060; text-align:center;" width="20%" | | ||
| + | ; | ||
| + | [[YunnaWei_InteractiveVisualization| <font color="#FFFFFF">Interactive_Visualization</font>]] | ||
| + | |||
| + | | | ||
| + | |} | ||
| + | <!--MAIN HEADER --> | ||
| + | |||
| + | |||
= Data Preparation = | = Data Preparation = | ||
Revision as of 16:02, 9 July 2017
Yunna Wei - ISSS608 Visual Analytics and Applications_Assignment1
|
|
|
|
|
|
Contents
Data Preparation
The given data sets are respectively a map and a csv file.
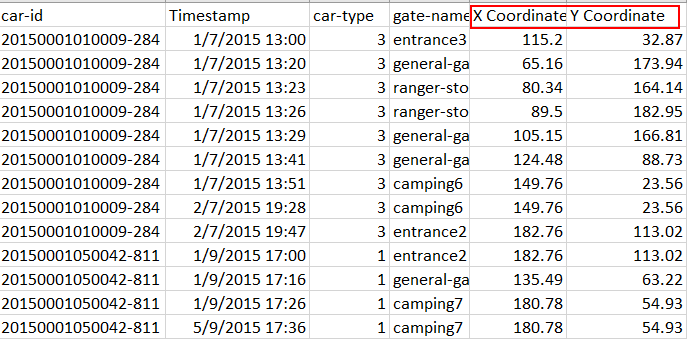
Mapping the coordinates of each location
| For the map, it will be useful to get the coordinates of each location so that we can plot the map with traffic going through to gave a whole picture of how the traffic looks like. Tableau is used to manually label the coordinates of each location. The locations are mapped within a 200x200 scale. |
Creating new variables
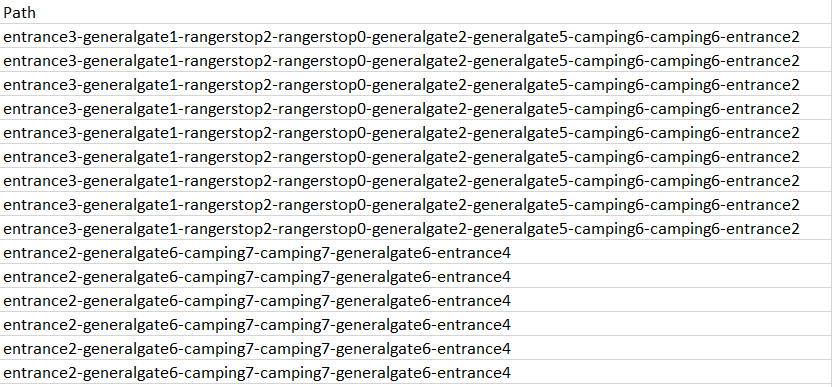
Travelling Path
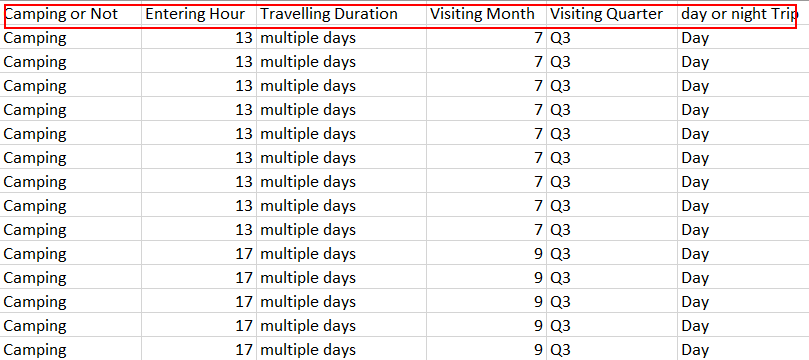
| The given csv data set has the variables of Car_id, timestamp,car-type, and gate name. To find out more information about the traffic patterns, new variables should be created based on the given variables. |
Other Variables
|


