Difference between revisions of "Assign NGO SIEW HUI Data"
Jump to navigation
Jump to search
(editorial) |
(editorial) |
||
| Line 39: | Line 39: | ||
'''Plot of X,Y-Coordinates with Map Overlay: ''' | '''Plot of X,Y-Coordinates with Map Overlay: ''' | ||
| + | <br/> <br/> | ||
| + | [[Image:ngo_locsmap2.png|600px]] | ||
| − | [[Image: | + | <br/> <br/> |
| + | |||
| + | '''Close-up View of Factories & Sensors Locations: ''' | ||
| + | <br/> <br/> | ||
| + | [[Image:ngo_locsmap.png|600px]] | ||
<br/> <br/> | <br/> <br/> | ||
Revision as of 22:38, 7 July 2017
|
|
|
|
|
|
|
Contents
Datasets Provided
The datasets consist of sensor readings from a set of air-sampling sensors and meteorological data from a weather station in proximity to the factories and sensors.
Location Data
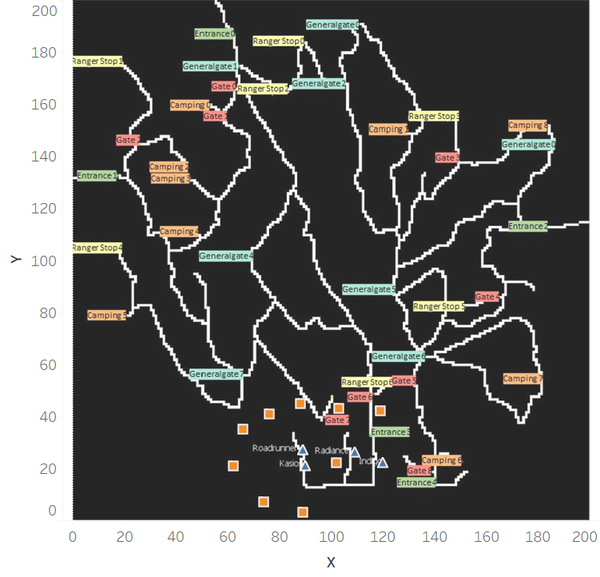
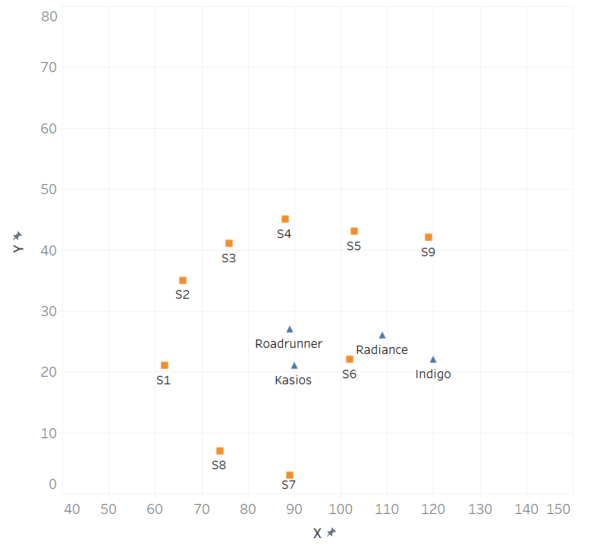
The factories and sensors locations are provided in terms of x,y coordinates on a 200x200 grid, with (0,0) at the lower left hand corner (southwest). The sensors map shows the locations of the sensors and factories by number for the sensors and by name for the factories. Some of the other features of the map (such as entrances and gates in that area) have been removed for readability.
Plot of X,Y-Coordinates with Map Overlay:

Close-up View of Factories & Sensors Locations:

Sensor Data
- [placeholder]
- [placeholder]
Meteorological Data
- [placeholder]
- [placeholder]
Data Preparation
- [placeholder]
- [placeholder]
Exploratory Analysis
- [placeholder]
- [placeholder]