Difference between revisions of "Assign NGO SIEW HUI Q3"
| Line 1: | Line 1: | ||
<!--2ND HEADER --> | <!--2ND HEADER --> | ||
{|style="background-color:1B338F;" width="100%" cellspacing="0" cellpadding="0" valign="top" border="0" | | {|style="background-color:1B338F;" width="100%" cellspacing="0" cellpadding="0" valign="top" border="0" | | ||
| − | | style="font-family:Century Gothic; font-size:100%; solid #000000; background:#2B3856; text-align:center;" width=" | + | | style="font-family:Century Gothic; font-size:100%; solid #000000; background:#2B3856; text-align:center;" width="15%" | |
; | ; | ||
[[ISSS608_2016-17_T3_Assign_NGO_SIEW_HUI| <font color="#FFFFFF">Background</font>]] | [[ISSS608_2016-17_T3_Assign_NGO_SIEW_HUI| <font color="#FFFFFF">Background</font>]] | ||
| Line 21: | Line 21: | ||
[[Assign_NGO_Q3| <font color="#FFFFFF">Question 3</font>]] | [[Assign_NGO_Q3| <font color="#FFFFFF">Question 3</font>]] | ||
| − | | style="font-family:Century Gothic; font-size:100%; solid #1B338F; background:#2B3856; text-align:center;" width=" | + | | style="font-family:Century Gothic; font-size:100%; solid #1B338F; background:#2B3856; text-align:center;" width="15%" | |
; | ; | ||
[[Assign_NGO_Conclusion| <font color="#FFFFFF">Conclusion</font>]] | [[Assign_NGO_Conclusion| <font color="#FFFFFF">Conclusion</font>]] | ||
| + | |||
| + | | style="font-family:Century Gothic; font-size:100%; solid #1B338F; background:#2B3856; text-align:center;" width="15%" | | ||
| + | ; | ||
| + | [[Assign_NGO_Comments| <font color="#FFFFFF">Comments</font>]] | ||
| | | | ||
Revision as of 18:46, 14 July 2017
|
|
|
|
|
|
|
|
Question 3
Which factories are responsible for which chemical releases? Carefully describe how you determined this using all the data you have available. For the factories you identified, describe any observed patterns of operation revealed in the data. Limit your response to no more than 8 images and 1000 words.
Response
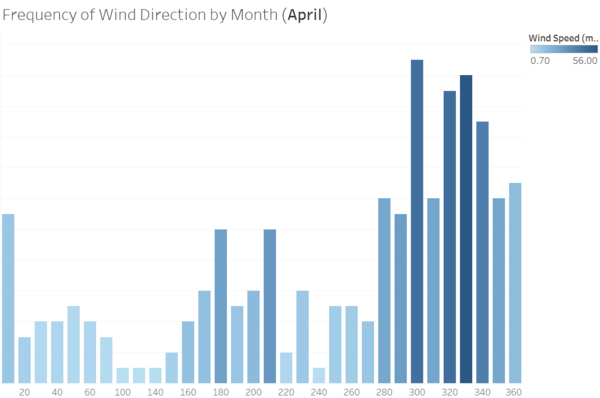
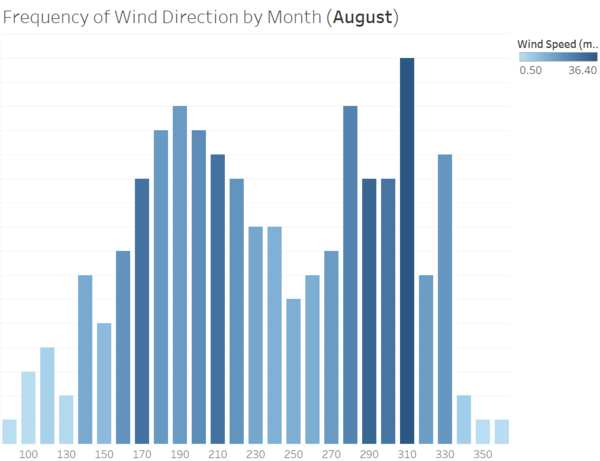
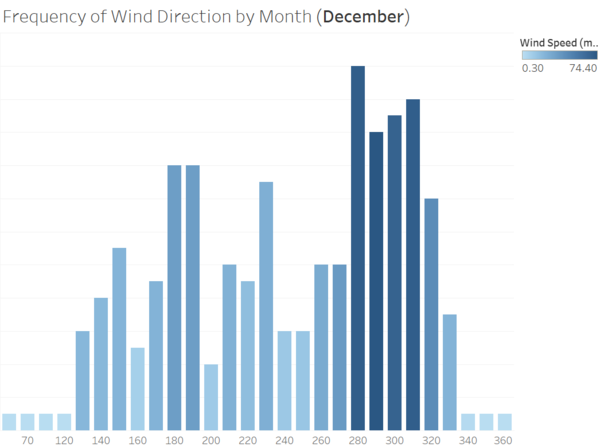
A dashboard showing the frequency of wind direction was developed to view the prevailing wind direction for a particular month. Below are 3 charts for the months of April, August and December respectively.

Prevailing wind direction for the month of April: North-West and North

Prevailing wind direction for the month of August: North-West and South

Prevailing wind direction for the month of December: North-West
Observation 1: As the prevailing wind was mostly in North-West direction for the months of April, August and December, the increasing trend of chemical readings captured by Sensor 4 was mostly likely due to Radiance Factory, and then followed by Indigo Sol Factory.