Difference between revisions of "Mandi Assignment Final Answer"
| Line 22: | Line 22: | ||
'''1. The scale and orientation of the supplied satellite images.'''<br /> | '''1. The scale and orientation of the supplied satellite images.'''<br /> | ||
Identified the location and coordinates of the Boonsong Lake in the satellite image as below: <br /> | Identified the location and coordinates of the Boonsong Lake in the satellite image as below: <br /> | ||
| − | The orientation of the satellite image is the same with that of the Boonsong Lake. | + | The orientation of the satellite image is the same with that of the Boonsong Lake. <br /> |
[[File:Lake.JPG|600px]] | [[File:Lake.JPG|600px]] | ||
[[File:Axis_Image.jpg|600px]] <br /> | [[File:Axis_Image.jpg|600px]] <br /> | ||
| Line 32: | Line 32: | ||
Most of the images have sensor artifacts at the bottom right corner. | Most of the images have sensor artifacts at the bottom right corner. | ||
To identify the features in the Preserve Area, I picked the image which is generated from the data [image11_2016_09_06.csv]. It has no sensor artifacts at all. | To identify the features in the Preserve Area, I picked the image which is generated from the data [image11_2016_09_06.csv]. It has no sensor artifacts at all. | ||
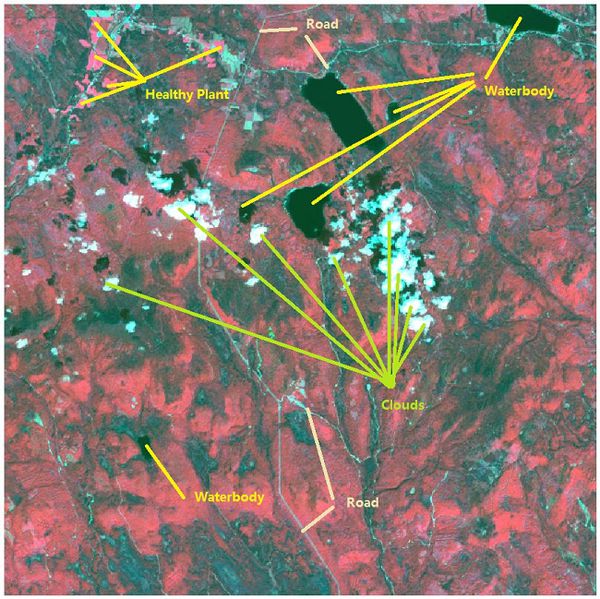
| − | Band combinations(B4, B3, B2) are mapped to the RGB image channels to create the false-color image as below.<br /> | + | <table width=100% border=1><tr bgcolor=#81D4FA><th>'''Visualizations'''</th><th>'''Interpretations'''</th></tr> |
| − | [[File:2016 09 06 | + | <tr> |
| − | Band combinations(B5, B4, B2) are mapped to the RGB image channels to create the false-color image as below:<br /> | + | <td width=60% align='center'>[[File:2016 09 06 Changes PlantHealth.jpeg|600px]]<br /></td> |
| − | [[File: | + | <td align='justify'>Band combinations(B4, B3, B2) are mapped to the RGB image channels to create the false-color image as below.<br /></td> |
| − | With the NDVI and RVI Value, we can identify the different vegetation. | + | </tr> |
| − | + | <tr> | |
| + | <tr> | ||
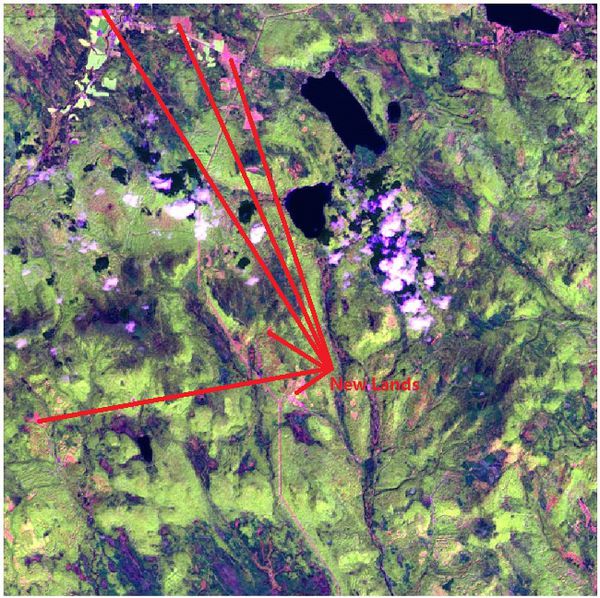
| + | <td width=60% align='center'> [[File:2016 09 06 Floods newLands.jpeg|650px|600px]]<br /></td> | ||
| + | <td align='justify'>Band combinations(B5, B4, B2) are mapped to the RGB image channels to create the false-color image as below:<br /></td> | ||
| + | </tr> | ||
| + | <tr> | ||
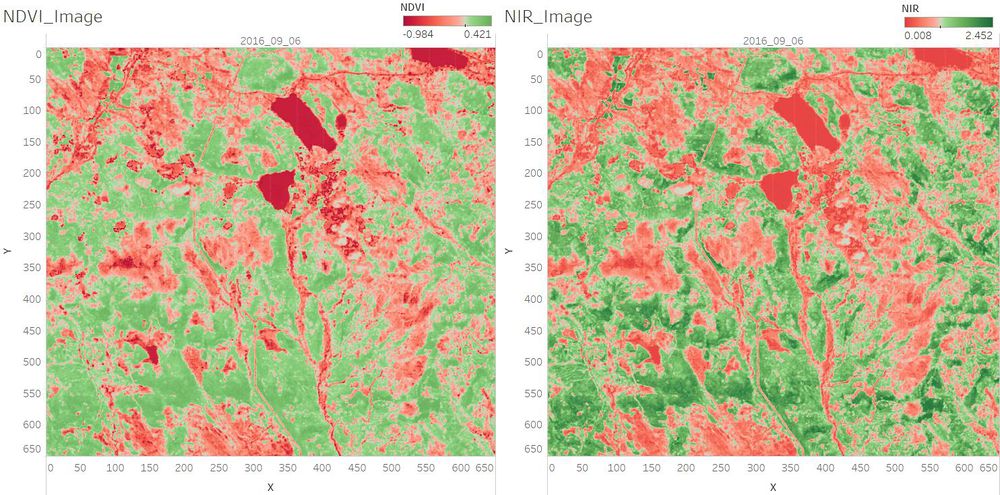
| + | <td width=60% align='center'> [[File:NDVI NIR.jpg|1000px]]<br /></td> | ||
| + | <td align='justify'> | ||
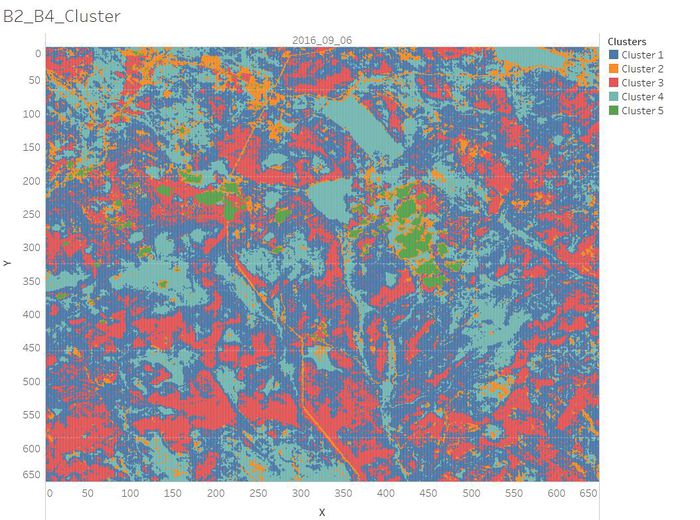
| + | With the NDVI and RVI Value, we can identify the different vegetation. <br /> | ||
* Cluster 1: Common vegetation with lower chlorophyll content. | * Cluster 1: Common vegetation with lower chlorophyll content. | ||
* Cluster 2: Road/Newly Land/Soil. | * Cluster 2: Road/Newly Land/Soil. | ||
| Line 43: | Line 51: | ||
* Cluster 4: Waterbody. | * Cluster 4: Waterbody. | ||
* Cluster 5: Clouds. | * Cluster 5: Clouds. | ||
| + | </td> | ||
| + | </tr> | ||
| + | </table> | ||
[[File:B2 B4 Cluster.jpg|700px]] | [[File:B2 B4 Cluster.jpg|700px]] | ||
<br /> | <br /> | ||
Revision as of 00:00, 8 July 2017
Questions:
1. The scale and orientation of the supplied satellite images.
Identified the location and coordinates of the Boonsong Lake in the satellite image as below:
The orientation of the satellite image is the same with that of the Boonsong Lake.
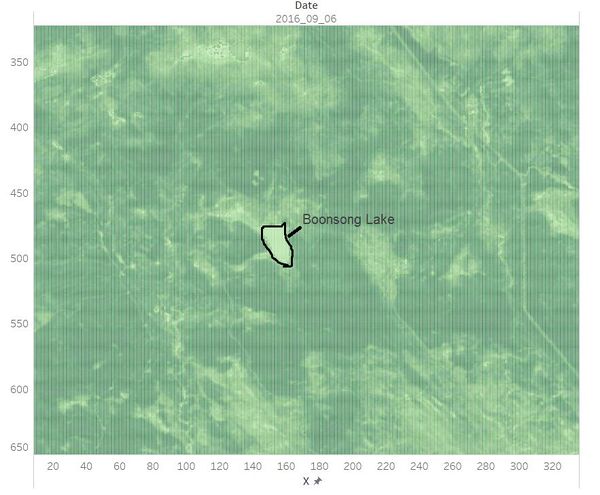
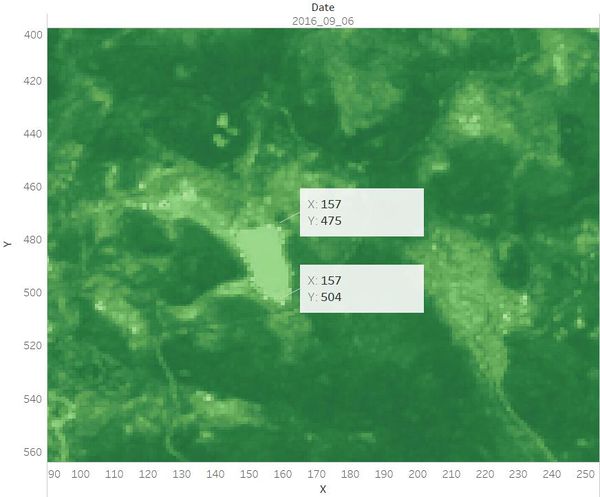
Hence, the length of a pixel is 3000/(504 - 475+1) ft, equals to 100 ft. Then the area of one pixel is 100 * 100 = 10000 square ft.
As the satellite image has 651*651 pixels, the actual scale of the region is 651*651*10000 square ft = 4,238,010,000 square ft.
The orientation of the satellite image is oriented north-south.
2. Features in the Preserve area as captured in the imagery.
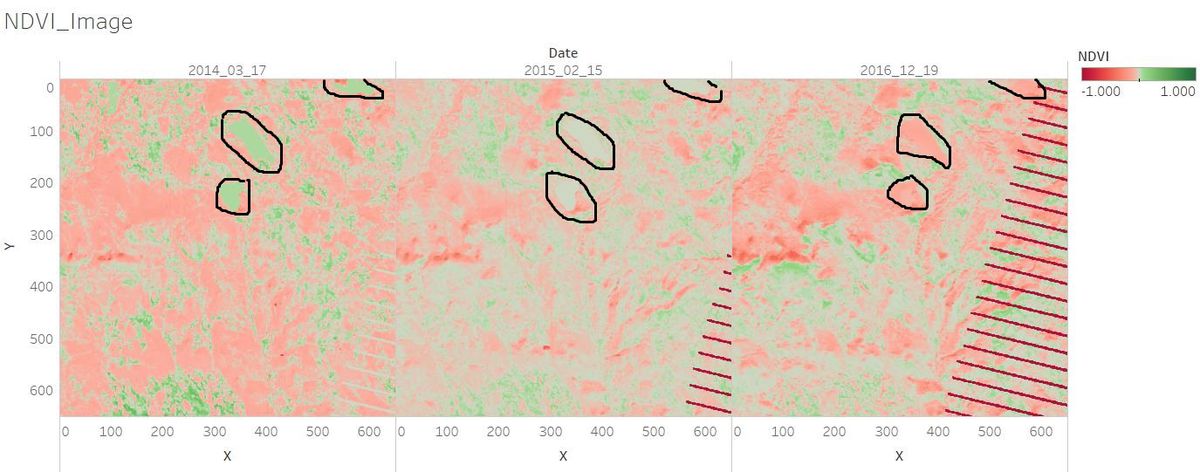
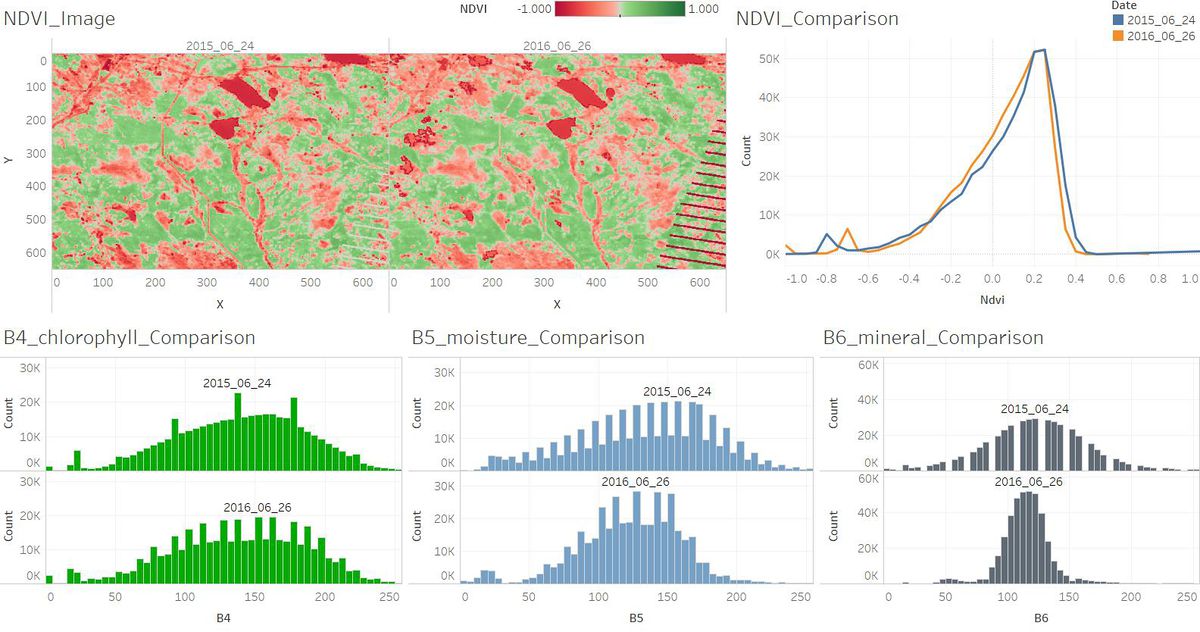
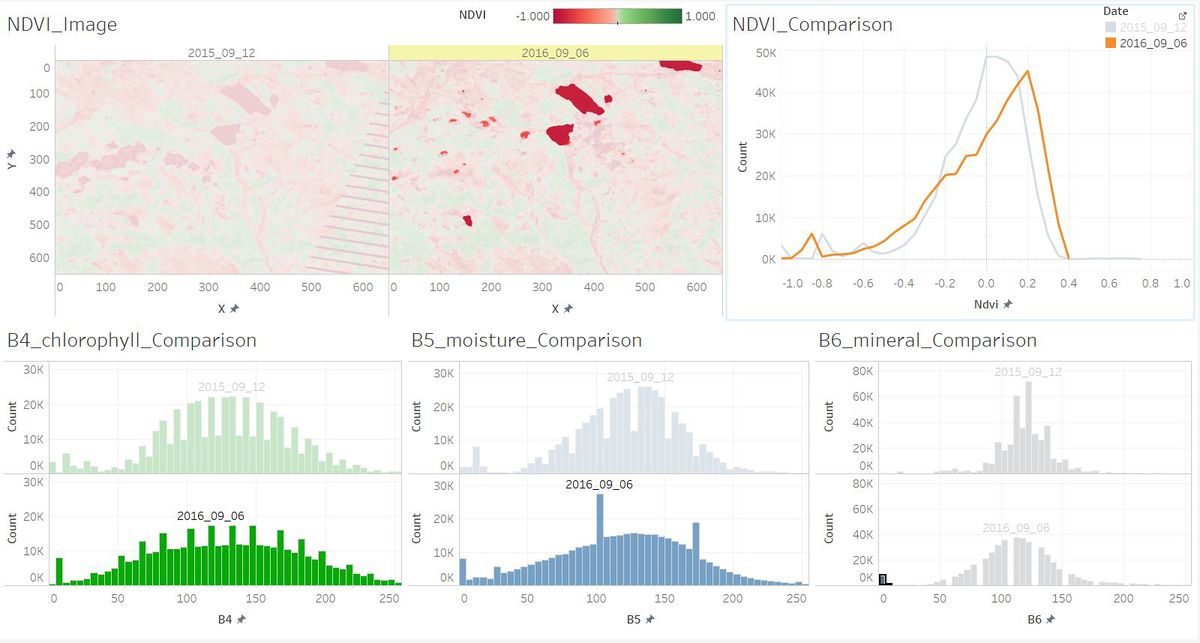
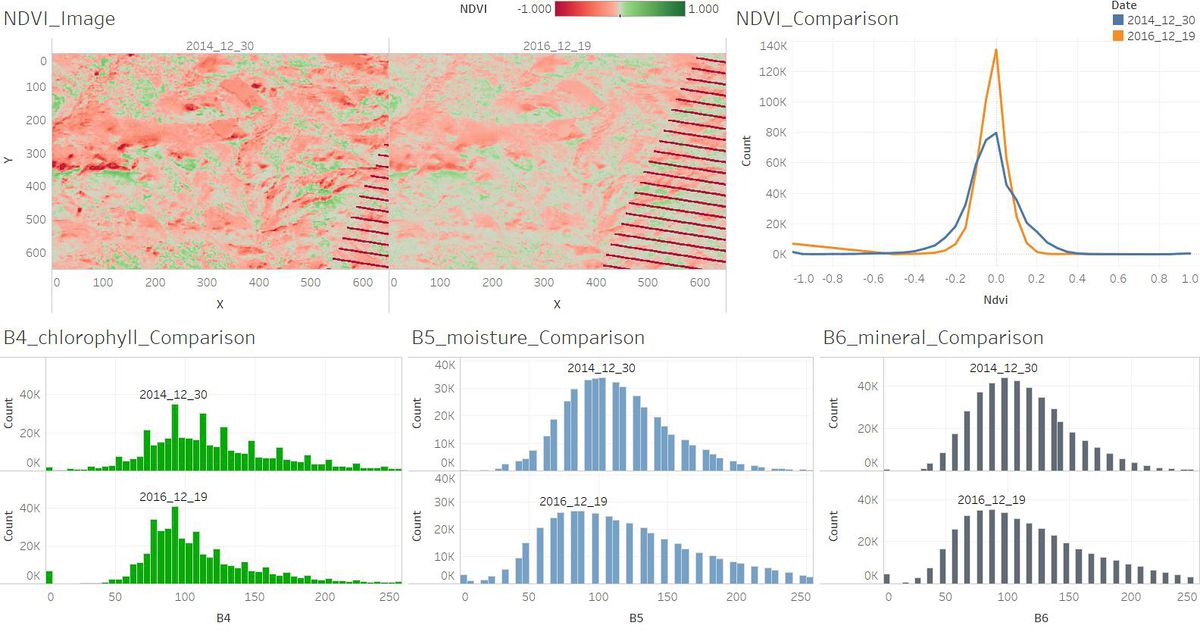
Most of the images have sensor artifacts at the bottom right corner.
To identify the features in the Preserve Area, I picked the image which is generated from the data [image11_2016_09_06.csv]. It has no sensor artifacts at all.
