Difference between revisions of "ISSS608 2016-17 T3 Assign CHEN YINJUE Data Analytics"
| Line 33: | Line 33: | ||
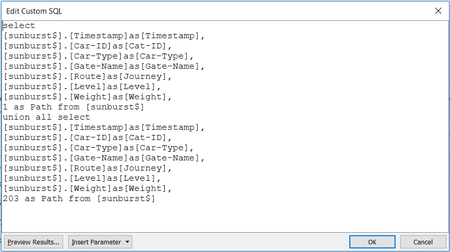
[[Image:SQL.png|450px]] | [[Image:SQL.png|450px]] | ||
| + | |||
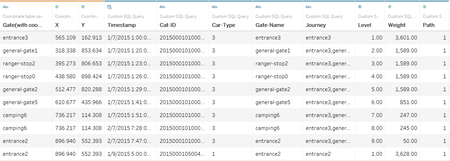
| + | Besides, to lay out the path on the map later, the coordinate table should also be loaded into tableau. So, at the left pane of ‘Data source’, click ‘Add’ (to the right of ‘Connection’) and choose file ‘Coordinate table’. After that, we can select ‘Coordinate table’ under ‘Connection’ and drag ‘Coordinate table.csv’ to join with ‘Custom SQL Query’ by matching the ‘gate name’ of these two sheets. Below shows a sample of output: | ||
| + | |||
| + | |||
| + | [[Image:Tableau datasource.png|450px]] | ||
<!--Data set description --> | <!--Data set description --> | ||
Revision as of 08:21, 6 July 2017
|
|
|
|
|
|
Data Visualization & Insights
After data preparation, now it's time to draw sunburst chart in tableau. Firstly, open tableau, under ‘Connect’ click ‘Excel’ and then select the Excel file we prepared before. Noted that we should choose ‘open with legacy connection’ in this step so that custom SQL can be used later. Secondly, drag ‘New Custom SQL’ to the area with ‘Drag tables here’ and apply SQL code as below:
Besides, to lay out the path on the map later, the coordinate table should also be loaded into tableau. So, at the left pane of ‘Data source’, click ‘Add’ (to the right of ‘Connection’) and choose file ‘Coordinate table’. After that, we can select ‘Coordinate table’ under ‘Connection’ and drag ‘Coordinate table.csv’ to join with ‘Custom SQL Query’ by matching the ‘gate name’ of these two sheets. Below shows a sample of output:


