Difference between revisions of "S-MALL Future Work"
Jump to navigation
Jump to search
Ycchen.2016 (talk | contribs) |
Zpchiam.2016 (talk | contribs) |
||
| (6 intermediate revisions by 2 users not shown) | |||
| Line 4: | Line 4: | ||
<p><font size = 3; color="#FFFFFF"><span style="font-family:Century Gothic;">Team S-MALL: Chen Yun-Chen | Chiam Zhan Peng | Zheng Bijun</span></font></p> | <p><font size = 3; color="#FFFFFF"><span style="font-family:Century Gothic;">Team S-MALL: Chen Yun-Chen | Chiam Zhan Peng | Zheng Bijun</span></font></p> | ||
</div> | </div> | ||
| − | {|style="background-color:# | + | {|style="background-color:#2e5b84;" width="100%" cellspacing="0" cellpadding="0" valign="top" border="0" | |
| style="font-family:Century Gothic; font-size:100%; solid #000000; background:#565656; text-align:center;" width="25%" | | | style="font-family:Century Gothic; font-size:100%; solid #000000; background:#565656; text-align:center;" width="25%" | | ||
; | ; | ||
| Line 19: | Line 19: | ||
| style="font-family:Century Gothic; font-size:100%; solid #1B338F; background:#2e5b84; text-align:center;" width="25%" | | | style="font-family:Century Gothic; font-size:100%; solid #1B338F; background:#2e5b84; text-align:center;" width="25%" | | ||
; | ; | ||
| − | [[S- | + | [[S-MALL_User Guide| <font color="#FFFFFF">User Guide</font>]] |
| | | | ||
| Line 33: | Line 33: | ||
[[File:T3 Appoverview.png|center|1200px]] | [[File:T3 Appoverview.png|center|1200px]] | ||
| − | == GUIDE == | + | == USER GUIDE == |
Part1: Movement Analysis | Part1: Movement Analysis | ||
{| class="wikitable" | {| class="wikitable" | ||
| Line 44: | Line 44: | ||
| | | | ||
<ul> | <ul> | ||
| − | <li>Plot by and Segment by are for line chart. | + | <li>"Plot by" and "Segment by" dropdown are used for line chart. Select "Segment by" will show cycle plot accordingly.</li> |
| − | <li>View | + | <li>"View" and "View hour" dropdown are for selecting date and hour respectively and display the inter-flow movement and hexbin map for that selected date and hour.</li> |
</ul> | </ul> | ||
|- | |- | ||
| Line 52: | Line 52: | ||
| | | | ||
<ul> | <ul> | ||
| − | <li>Hover on | + | <li>Hover on any points on the line chart to display the tooltip for detailed information.</li> |
</ul> | </ul> | ||
|- | |- | ||
| Line 59: | Line 59: | ||
| | | | ||
<ul> | <ul> | ||
| − | <li>Hover on the | + | <li>Hover on the chorddiagram to display the tooltip for detailed information.</li> |
<li>Example: There are 61 customers moving from 3F to 2F and 57 customers moving from 2F to 3F at selected time.</li> | <li>Example: There are 61 customers moving from 3F to 2F and 57 customers moving from 2F to 3F at selected time.</li> | ||
</ul> | </ul> | ||
| Line 67: | Line 67: | ||
| | | | ||
<ul> | <ul> | ||
| − | <li>Click on | + | <li>Zoom in by selecting area with left click hold and release as required and click on any hexbin for the selected hexbin to be captured.</li> |
| + | <li>Click on "Show Detail" button to show the distribution of the selected hexbin. Members and Non-members count will be displayed. </li> | ||
</ul> | </ul> | ||
|- | |- | ||
! scope="row" style="background: #ffffff;"| | ! scope="row" style="background: #ffffff;"| | ||
| − | [[File:T3 | + | [[File:T3 Part1 bar.jpg|center|300px]] |
| | | | ||
<ul> | <ul> | ||
| − | <li></li> | + | <li>Click on the bar chart to show detailed information such as their Device ID and number of counts. </li> |
| + | </ul> | ||
| + | |- | ||
| + | ! scope="row" style="background: #ffffff;"| | ||
| + | [[File:T3 Part1 table.jpg|center|300px]] | ||
| + | | | ||
| + | <ul> | ||
| + | <li>Count means the customer stays in selected hexbin for how long (min) in selected time interval.</li> | ||
</ul> | </ul> | ||
|- | |- | ||
Latest revision as of 15:44, 6 August 2017
Turning Concrete Malls into Smart Malls (S-MALL):
A web-based analytics application for visualizing and mapping in-mall customer journeys and shopping behaviours
Team S-MALL: Chen Yun-Chen | Chiam Zhan Peng | Zheng Bijun
|
|
|
|
|
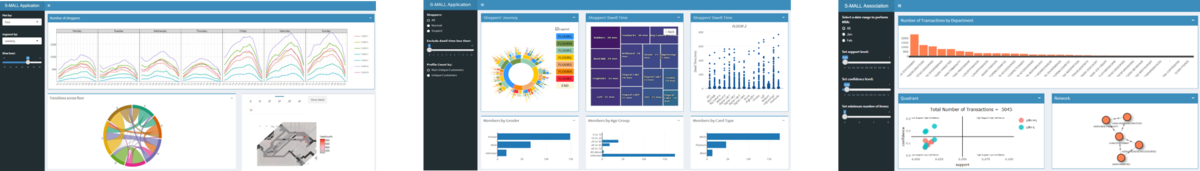
APPLICATION
| Movement Analysis | Member Analysis | Association Analysis |

USER GUIDE
Part1: Movement Analysis
| Screenshot | Guidance |
|---|---|
 |
|
 |
|
 |
|
 |
|
|
Error creating thumbnail: File with dimensions greater than 12.5 MP |
|
 |
|
Part2: Member Analysis
| Screenshot | Guidance |
|---|---|
 |
|
 |
|
 |
|
 |
|
 |
|
Part3: Association Analysis
| Screenshot | Guidance |
|---|---|
 |
|
 |
|
 |
|
 |
|
 |
|
Please be patient.