Difference between revisions of "Mandi Assignment Final Answer"
| Line 17: | Line 17: | ||
|} | |} | ||
<br/> | <br/> | ||
| − | + | =Questions= | |
| − | + | ==Q1. The scale and orientation of the supplied satellite images.== | |
Identified the location and coordinates of the Boonsong Lake in the satellite image as below: <br /> | Identified the location and coordinates of the Boonsong Lake in the satellite image as below: <br /> | ||
The orientation of the satellite image is the same with that of the Boonsong Lake. <br /> | The orientation of the satellite image is the same with that of the Boonsong Lake. <br /> | ||
| Line 28: | Line 28: | ||
The orientation of the satellite image is oriented north-south.<br /> | The orientation of the satellite image is oriented north-south.<br /> | ||
| − | + | ==Q2. Features in the Preserve area as captured in the imagery.== | |
Most of the images have sensor artifacts at the bottom right corner. | Most of the images have sensor artifacts at the bottom right corner. | ||
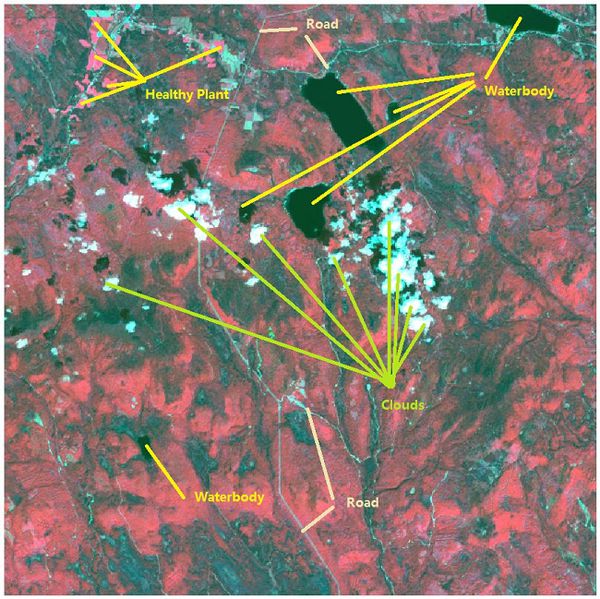
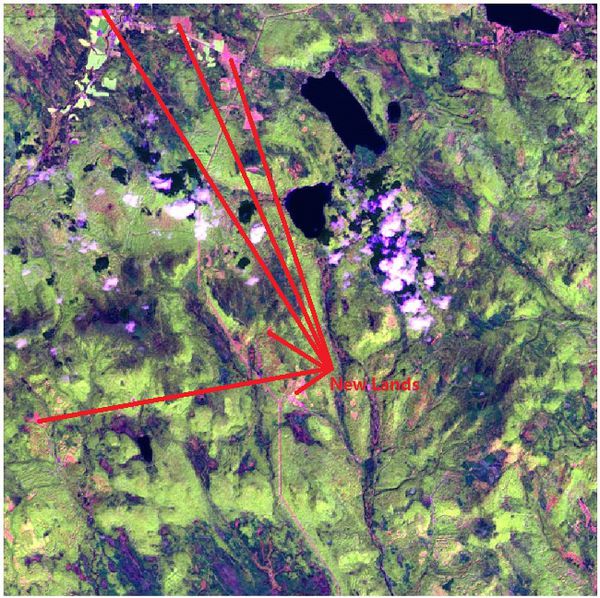
To identify the features in the Preserve Area, I picked the image which is generated from the data [image11_2016_09_06.csv]. It has no sensor artifacts at all. | To identify the features in the Preserve Area, I picked the image which is generated from the data [image11_2016_09_06.csv]. It has no sensor artifacts at all. | ||
| Line 62: | Line 62: | ||
<br /> | <br /> | ||
| − | + | ==Q3. Features that change over time in these images.== | |
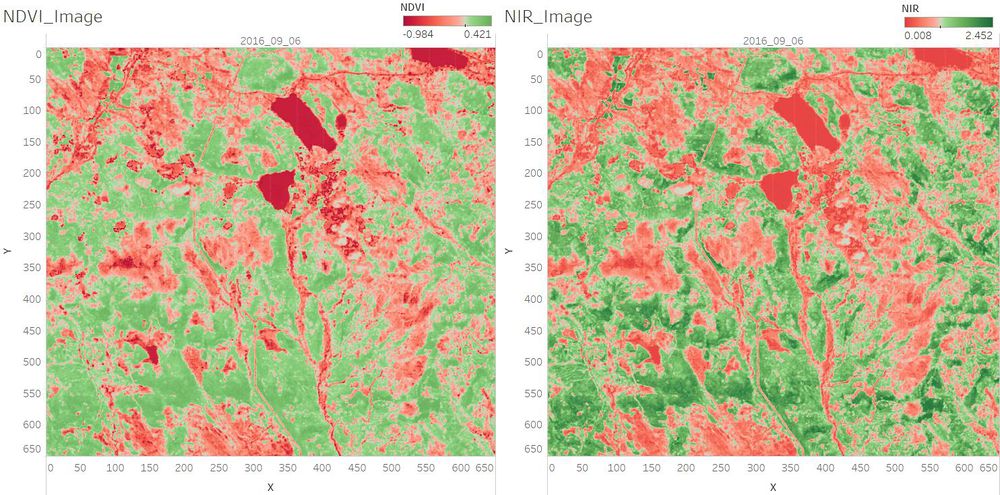
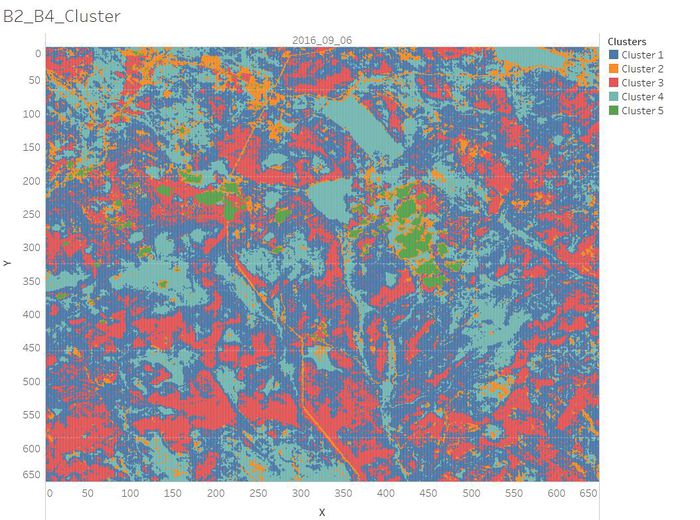
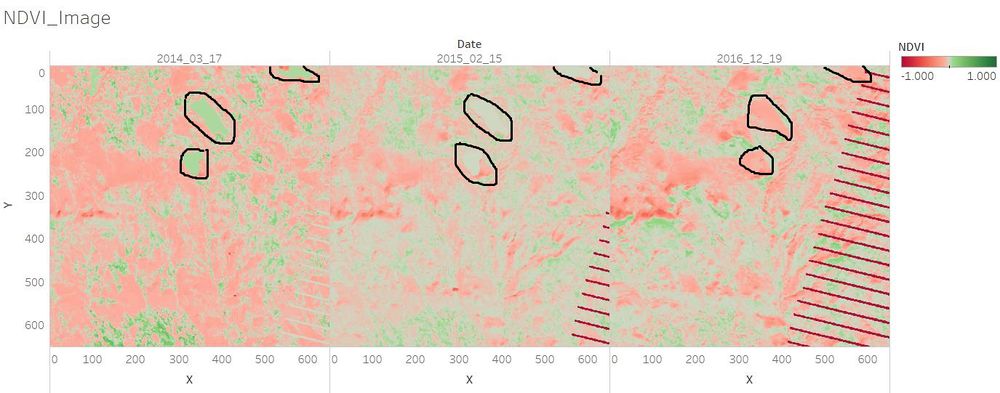
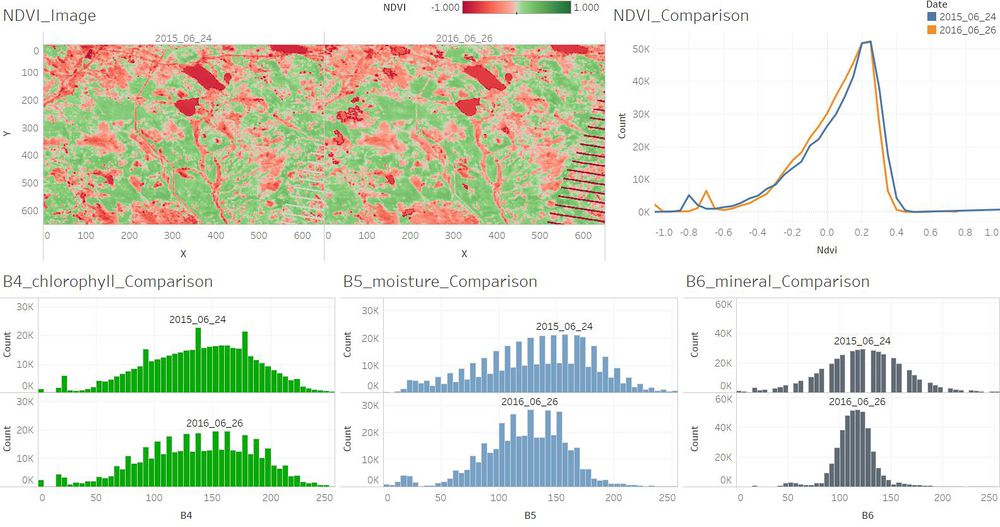
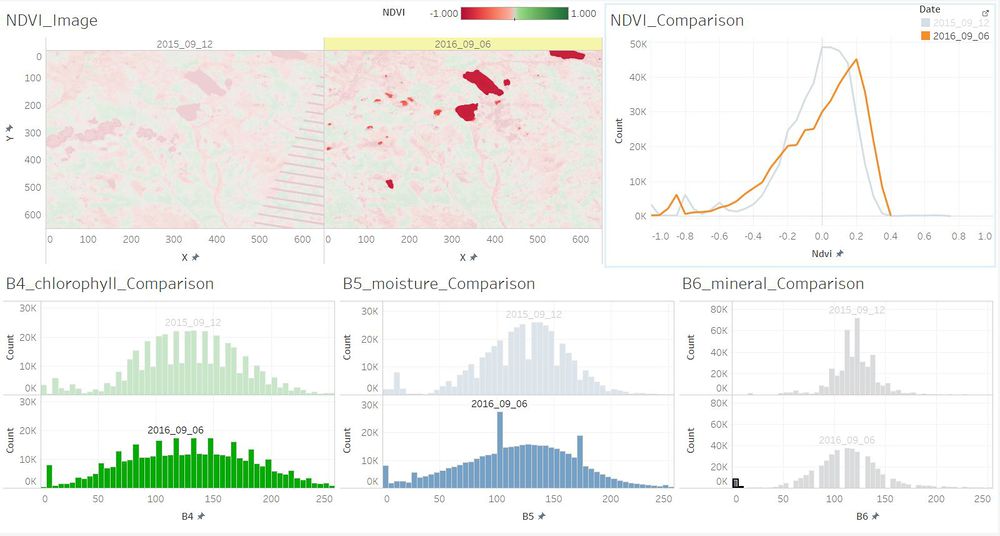
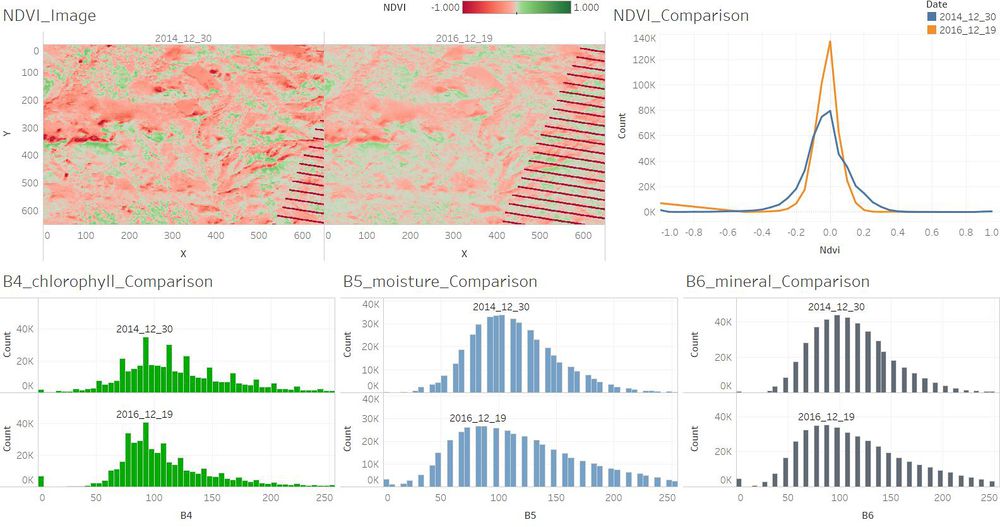
In general, the waterbody became more pure from 2014 to 2016. The plants which are with higher chlorophyll content became less from 2014 to 2016. <br/> | In general, the waterbody became more pure from 2014 to 2016. The plants which are with higher chlorophyll content became less from 2014 to 2016. <br/> | ||
The visualization analysis results are as below. <br/> | The visualization analysis results are as below. <br/> | ||
Revision as of 19:37, 14 July 2017
Contents
Questions
Q1. The scale and orientation of the supplied satellite images.
Identified the location and coordinates of the Boonsong Lake in the satellite image as below:
The orientation of the satellite image is the same with that of the Boonsong Lake.
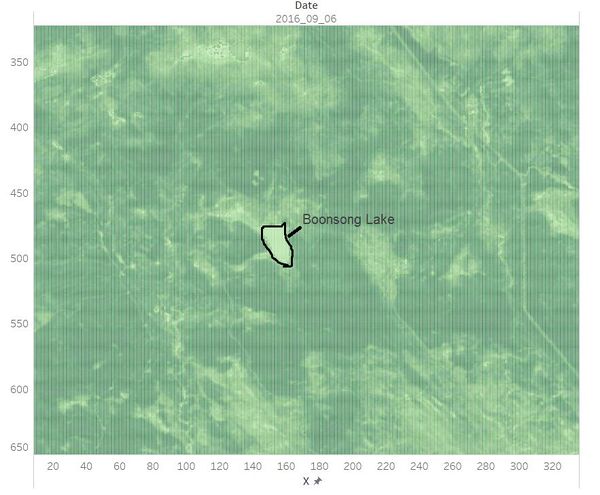
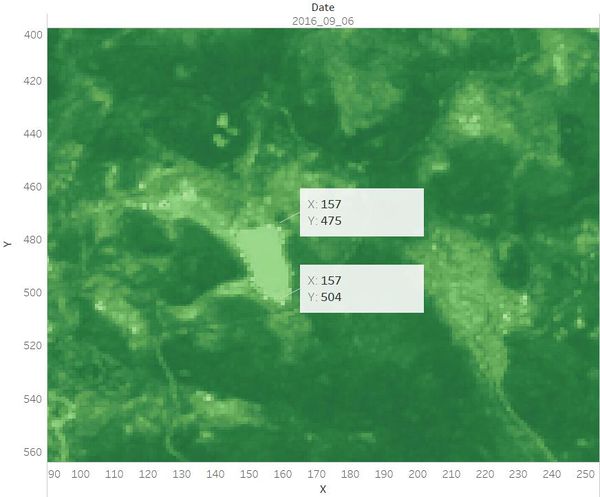
Hence, the length of a pixel is 3000/(504 - 475+1) ft, equals to 100 ft. Then the area of one pixel is 100 * 100 = 10000 square ft.
As the satellite image has 651*651 pixels, the actual scale of the region is 651*651*10000 square ft = 4,238,010,000 square ft.
The orientation of the satellite image is oriented north-south.
Q2. Features in the Preserve area as captured in the imagery.
Most of the images have sensor artifacts at the bottom right corner. To identify the features in the Preserve Area, I picked the image which is generated from the data [image11_2016_09_06.csv]. It has no sensor artifacts at all.
Q3. Features that change over time in these images.
In general, the waterbody became more pure from 2014 to 2016. The plants which are with higher chlorophyll content became less from 2014 to 2016.
The visualization analysis results are as below.
