ISSS608 2016 17T3 Group6 Report
ISSS608 Project - Group 6
|
|
|
|
|
|
Contents
Motivation of the application
Recently, happiness is considered to be the proper measure of social progress and the goal of public policy. According to World Happiness Report 2017, Norway is the happiest country in the world and Singapore is the happiest country in Asia. With the raw data given retrieved from Kaggle, the following interested questions would like to be approached:
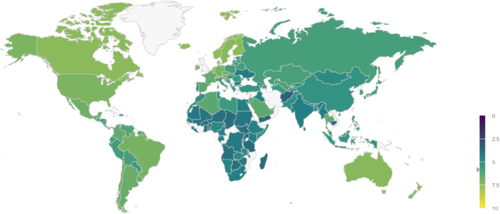
- How is country happiness score distributed globally?
- How is happiness score measured?
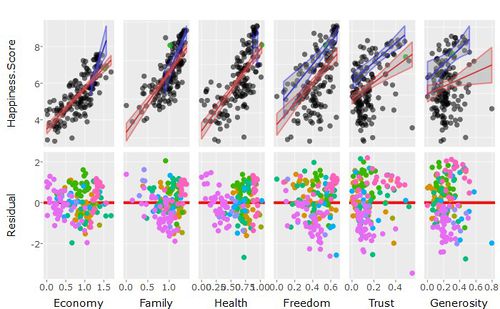
- What factors influence the residences’ happiness the most?
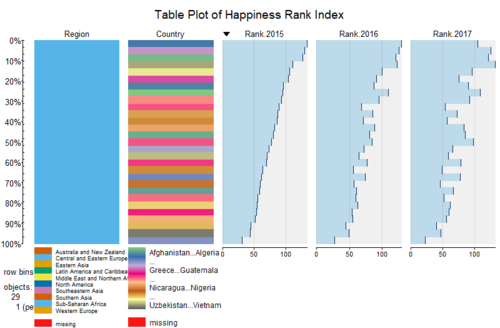
- How does country happiness ranking change over the time?
- Which countries are outperformed in 2015, 2016, and 2017, and in what aspect?
Review and critic on past works
Design framework
Demonstration
Discussion
World overall happiness score dependency
The study shows that the world happiness score is proportional to all factors. Among all the factors, Freedom, Trust, and Health are the three factors influence the happiness scores the most. People feel happier if their country has more opportunities that people would be free to determine by themselves, less absence of corruption, and healthier life expectancy. Moreover, among these three factors, Freedom is the most important factor to determine the world happiness score from 2015 to 2017. In contrast, generosity is the most insignificant factor to world’s happiness score.
From 2015 to 2017, the influence of Trust to the happiness score is more and more significant through the years, whereas people do not think Generosity is as important as before in 2017. Other factors such as health and freedom are almost kept stable through the years.
Region happiness score dependency
(Region North America, and Australia and New Zealand are not analyzed in this analysis before there are only two countries in these regions. Bias maybe countered in due to their small amount of data.)
- Economy (GDP) is the most significant factor to determine the happiness score of Western Europe. However, the influence of economy is decreasing from 2015 to 2017, whereas the influence of Trust (absence of corruption) is becoming greater through the years.
- The most important factor for Middle East and Northern Africa is healthy life expectancy, unlike the world trend. And through the years, the influence of the Health for their people has increased significantly along the time.
Outperformed countries
- Syria performed much better in Health and Generosity than other countries whose happiness score is similar to Syria’s happiness score.
- Somalia did not performed well in economy in 2016 and 2017 comparing with other countries with the similar happiness score. Its happiness rank has been dropped from 76 to 93 in 2017 might be due to its un-well performance in economy.
- Unlike Somalia, Myanmar, who performed well in Freedom and Generosity, and Rwanda, who was outstanding in Freedom and Trust through the years have ranked higher and higher than before.
- Compared with the changes of happiness rankings within the specific region, countries with obvious difference over three years shown in tableplot are as follows: happiness rankings of Latvia (Western Europe), Algeria (Africa) and Philippines (South-eastern Asia) were improved continuously since 2015, while residences of India (South Asia), Ukraine (Western Europe), Liberia(Africa) and Venezuela (Latin America and Caribbean) have been feeling less happier since 2015 till now.
Country clusters
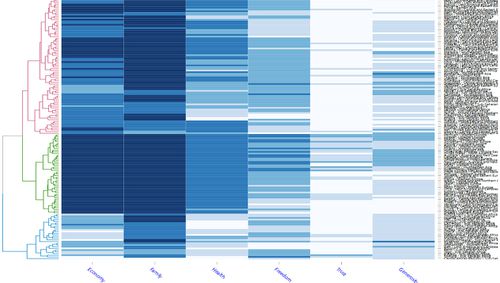
| Cluster | Feature | Typical Countries |
|---|---|---|
| Composite Group | Family factor is the primary determinant for residences in this group. Meanwhile, Economy and Health are taken into consideration as well. | China, Malaysia, Thailand |
| Family & Economy Centric Group | Both Family and Economy are significant to make them happy. People in this group also regard Health as an important factor. | Singapore and other developed countries |
| Family-centric Group | Family is the most and almost the only important factor of happiness among all. | Almost all members of this group are from sub-Saharan |
Country happiness trend
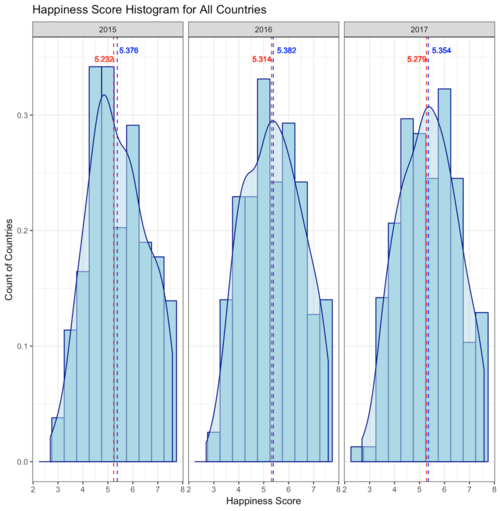
With right-skew distribution of happiness score and decreasing mean and median score annually, Western Europeans are relatively happy but less happier every year (which is observed from the histogram).
Future work
- Enable interactions for tableplot so that the country related information would be shown up when mouse over.
- The application will be feasible to load new data and output charts with new datasets.
- The scale of heatmap can be adjusted automatically based on number of countries shown in the application, in order for user to have a clearer look of country properties.
- The range of x-axis in regression analysis charts should be unique, so that users are able to easily catch which independent variable has the deepest slope.
Installation guide
Only R packages which are used in this project is mandatory to install, and all packages can be installed by R command “install.packages()”.
R packages:
data.table, plotly, ggplot2, GGally, scales, shiny, shinyBS, Shinydashboard, shinythemes, Dplyr, Leaflet, Highcharter, Countrycode, Tabplot, d3heatmap
User guide
Step1: Setup directory
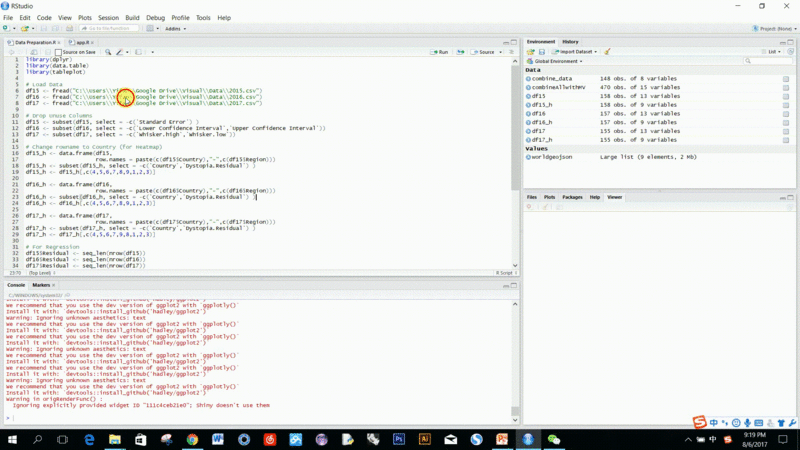
Users would like to save data into their own directory, and set the path lead to the preset directory with following code when retrieve data in Data Preparation.r:
df15 <- read.csv("user directory\\2015.csv")
df16 <- read.csv("user directory\\2016.csv")
df17 <- read.csv("user directory\\2017.csv")
Step 2: Run Application
User would like to click RUN in rstudio, or use keyboard SHIFT+CTRL+ENTER to run app.r.
Step 3: Overall Picture
The first page shown up in the application is data Overall Picture. In this page, users are able to:
- Take a look of the overall distribution of happiness scores over the world though the world map and histogram
- Using Select Year to determine which year the user would like to focus on
- Using Select Region drop down list to filter by region
Step 4: Overall Ranking
By selecting the second tab 2. Overall Ranking at the top of the application, users are able to:
- Take a look of counties' happiness ranking in the world
- How the ranking of each country varies along the time
- Using Select Region drop down list to filter by region to view how the ranking of countries varies in the region
Step 5: Influential Factors of Happiness
By selecting the third tab 3. Influencial Factors of Happiness at the top of the application, users are able to:
- The linear regression line (red line) of each independent variables to Happiness score from Regression chart
- Isolated countries for each independent variable in Residual chart
- How each variable influence the happiness score of each country in heatmap. The deeper the color is, the more influential the independent variable is.
- Clusters of countries based on the independent variable influences
Using Select Region drop down list to filter by region to see:
- The linear regression line of each variable of the region (blue line)
- Clusters of countries in the selected region based on the influence of each variable in the heatmap
Using Year to select which year the user would like to focus on.
Using Select Happiness Ranking Range to filter countries by their happiness ranking.
Using Select No. of Clusters to select the number of clusters that user would like to group the countries into.
