ISSS608 2016-17 T3 Assign TEN KAO YUAN MC1
|
|
|
|
|
|
|
Contents
Mini-Challenge 1 : Patterns of Life...or Death?
Introduction
We are required to analyze traffic data entering and exiting the Boonsong Lekagul Nature Preserve. Traffic enters and exits the Preserve through official Entrances. There are several Campgrounds where both day-camping and overnight camping are allowed. There are certain roadways restricted to the Preserve Rangers only. The Preserve Rangers are monitoring traffic through the preserve. Each vehicle travelling within the Preserve carries an RFID tag which produces a log each time the vehicle passes near sensors located at specific segments or gates located at various points of the Preserve.
Type of Gates
There are five types of Gates :
| Gate Type | Description |
|---|---|
| Entrances | All vehicles pass through an Entrance when entering or leaving the Preserve. |
| General-gates | All vehicles may pass through these gates. These sensors provide valuable information for the Preserve Rangers trying to understand the flow of traffic through the Preserve. |
| Gates | These are gates that prevent general traffic from passing. Preserve Ranger vehicles have tags that allow them to pass through these gates to inspect or perform work on the roadway beyond. |
| Ranger-stops | These sensors represent working areas for the Rangers, so you will often see a Ranger-stop sensor at the end of a road managed by a Gate. Some Ranger-stops are in other locations however, so these sensors record all traffic passing by. |
| Camping | These sensors record visitors to the Preserve camping areas. Visitors pass by these entering and exiting a campground. |
Types of Vehicles
When vehicles enter the Preserve, they must proceed through a gate and obtain a pass. The gate categorizes vehicles as follows:
- 2 axle car (or motorcycle)
- 2 axle truck
- 3 axle truck
- 4 axle (and above) truck
- 2 axle bus
- 3 axle bus
DATA PREPARATION
The sensor data set contains 171477 observations with 18708 unique vehicles IDs. The data set poses the following challenges:
- We are not given the gate coordinates on the map
- Each vehicle ID has it's own number of sequences of gates and time stamps
Gate Coordinates
A quick and dirty method to obtain the coordinates is to use Tableau's annotate utility. The 'Lekagul Roadways labeled v2' jpeg file is selected as a background image with a 200x200 grid and origin at the top left (note that this image's resolution is 982 x 982 pixels). Dummy measures A and B are created with value 200 and placed in the columns and rows respectively. These measures are required to display the background image properly. By right clicking a location on the image and selecting the 'Annotate' function, followed by Point, we are able to label a point on the grid corresponding to the desired location on the background image. By positioning the pointer of the annotation to a different position, we are able to read out the various coordinates of the different gates.
These are the coordinates that we obtained for the various gates.
| Gate Name | X Coordinate | Y Coordinate |
|---|---|---|
| camping0 | 53 | 158 |
Sequence Data
The sequence data can be analyzed using various methods to understand how the vehicles spend their time within the park. During the analysis, different methods were attempted with various degrees of success.
- Tabulation
- Sunburst Diagram
- Path Diagram
- Gantt Chart
Tabulation
To extract the sequence of each carID, the following formulas were used in tableau. It has to be calculated using the timestamp which is added as a Detail in order to give the correct result. To extract the time stamps, replace "Gate Name" with "Timestamp"
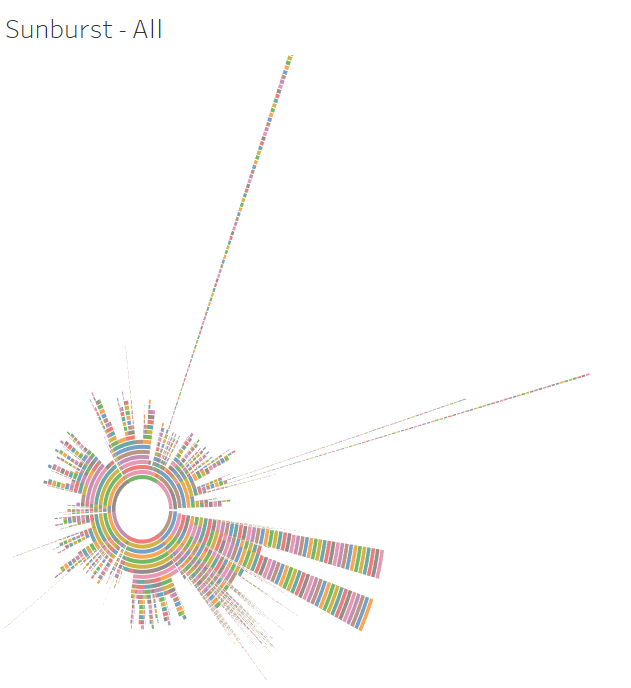
Sunburst Diagram
A sunburst diagram was created following Bora Beran's blog and referring to these video's from SuperDataScience's Youtube channel
https://public.tableau.com/profile/bora.beran#!/vizhome/RadialCharts-Part2/RadialTreemap
https://www.youtube.com/watch?v=GEf-k5iPAW8&t=236s
https://www.youtube.com/watch?v=N7DacIDqQbo
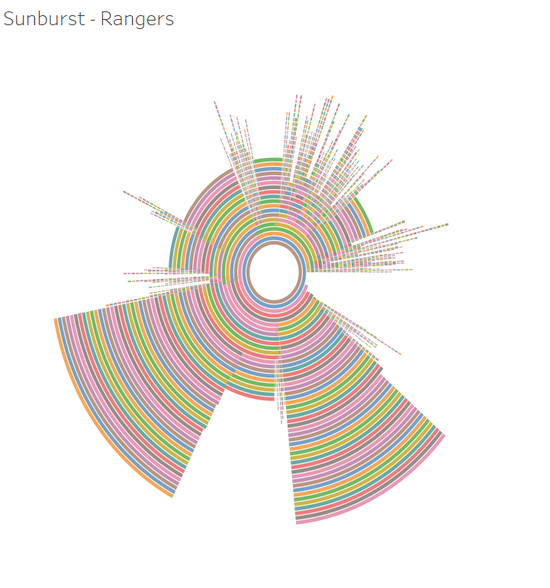
This sunburst digram served more as a standalone investigation tableau workbook to initiate ideas. For example, just by looking at the sunburst we can see that there are sequences with an extremely high number of gates.
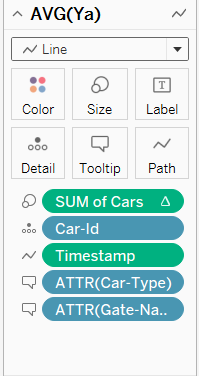
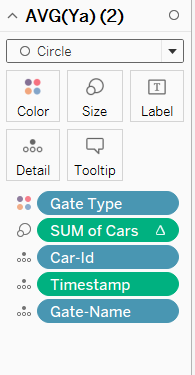
Path Diagram
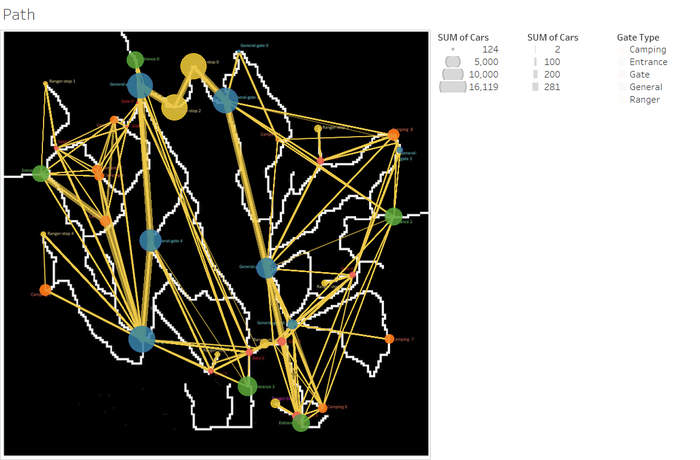
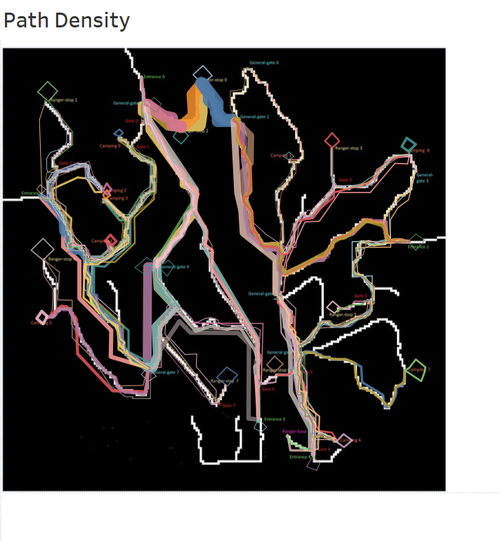
The path diagram was created using these settings:
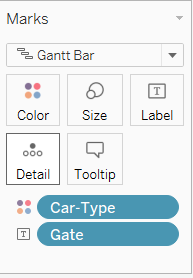
Gantt Chart
The Gantt Chart is useful to visualize the spread of the various vehicle IDs over time. It it created using these settings :
Tableau Visualization available here : https://public.tableau.com/profile/david.ten.kao.yuan#!/vizhome/MC1/Story1?publish=yes
DATA EXPLORATION
We explore this data set to identify general patterns and trends. The challenge of this data set is that it requires both geo-spatial and temporal analysis of the path sequences of the vehicles travelling throughout the park. A general exploration of the data is conducted to get a feel of the dataset.
Temporal Exploration
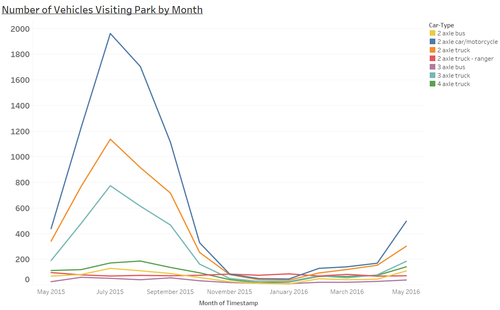
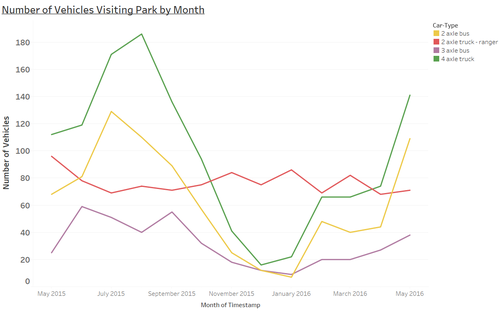
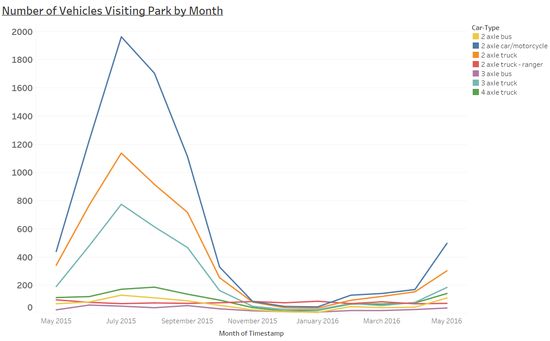
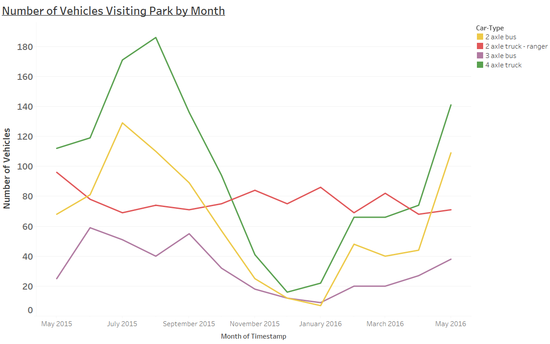
Plotting the number of vehicles by type and month, we observe that the park has a majority of visitors in from May to September. This indicates that the park would be located in the Northern Hemisphere as these corresponds to the warmer period of the year where there would be more wildlife to observe and more visitors (e.g. summer holidays). There is a peak in July for vehicles type 1, 2, and 3 (car, motorcycle, 2 and 3 axle truck). Similarly, the numbers of vehicles 4, 5, and 6 also peak around the same time. The number of 2P vehicles (park rangers) remains stable throughout the year. Visitors in vehicles 1, 2 and 3 are likelier to be leisure visitors who come and go independently when they please whereas vehicles 4 are likelier to be utility vehicles servicing the park (provision of supplies, trash removal, etc.) or just passing through the park as part of their larger route (e.g. transport vehicles). Buses of type 5 and 6 would ferry visitors to and from the park in larger numbers. The number of vehicles drops in December and January as it is winter, making it hard to navigate the park and the animals would be in hibernation.
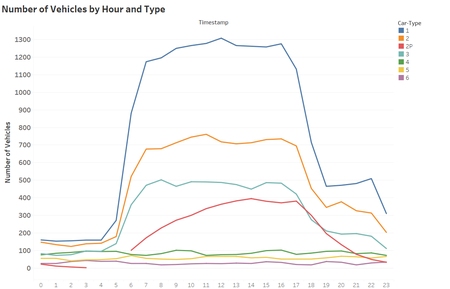
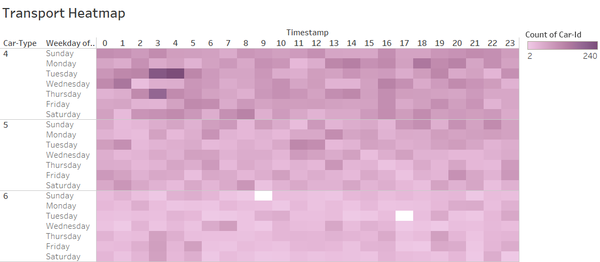
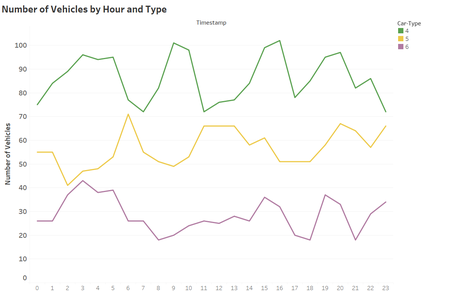
When plotting the number of vehicles by type and hour, we observe that the majority of the visits for vehicles type 1, 2 and 3 occur during the day between 7am and 7pm. This is unsurprising as the majority of park visitors would prefer to visit during the day when the flora and fauna are readily visible. Overnight campers are also likelier to stay put at night and travel around the park when it is bright for safety and practical reasons, hence their movement is only detected at the gates in the day. On the other hand the numbers of vehicles 4, 5 and 6 remain similar throughout the day. Given that the number remains steady throughout the day, it is much likelier that these vehicles are transport vehicles (lorries transporting goods, bus services, etc.) passing through the park instead of utility vehicles servicing the park. Utility vehicles would be more active in the day when typical service activities need to carried out whereas transport vehicles are likelier to travel at any time of the day to reach their destination. We also observe the number of ranger vehicles varies throughout the day - in general ranger vehicles are more active between 6am and 23pm. There are no ranger patrols between 3am and 6am.
Geospatial Exploration
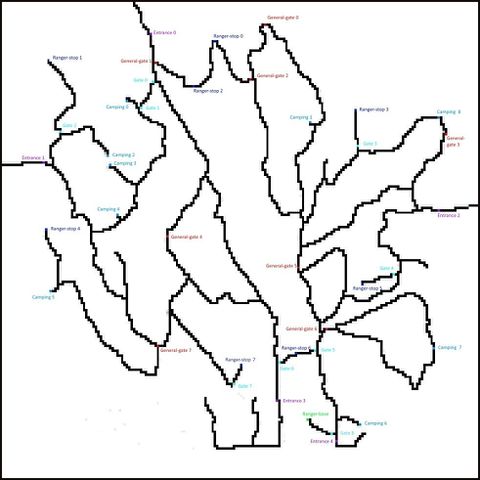
The different roadways running through the park are depicted in the map. There are 5 entrances into the park - Entrance 0 to the North West, Entrance 1 to the East, Entrance 2 to the West and Entrance 3 and 4 to the South. Based on information in Mini-Challenge 2, we know that there are factories located at the South of the park, near Entrance 3. All vehicles, except for park rangers, enter and exit the park via these entrances. All vehicles, except for park rangers, should begin and end their journey at one of the entrances.
There are 9 camping areas throughout the park. 4 of the camping areas are located close together to each other in the West - Camping 0, 2, 3 and 4. It is possible that there a natural attraction near these camping sites, like a waterfall or a lake. Vehicles spending time at a camp site would have a double time stamp; the first indicating the time of entry into the camping site and the second indicating the time of exit from the camping site. Based on the time difference, it is possible to distinguish between day campers and longer term campers.
The ranger base is located to the South, close to Entrance 3. Some ranger stops are only exclusively accessible to the rangers as they are located behind gates that bar access to other vehicles - ranger stops 1, 3, 4, 5, 6 and 7 fall into this category. On the other hand ranger stops 0 and 2 are gate points that need to be traversed in order to travel between general gate 1 and general gate 2. Rangers stopping at the various ranger stops would also have double time stamps - the first indicating the time of entry and the second indicating the time of exit
Looking at the topology of the paths, we note that some gates are connected by more than one path. For example there are 2 possible paths betwen general gate 6 and camping 7, and 3 possible paths between general gate 5 and entrance 2.
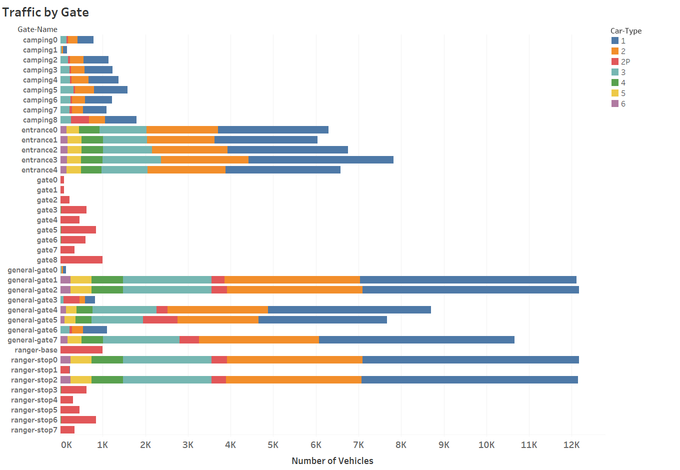
Based on the traffic by gate, we observe roughly an equal number of vehicles going through the 5 entrances. There is no preferred entrance into the park. However, since there are 2 entrances at the South of the park, this indicates that there are more vehicles passing through the southern exits. This is possibly due to the presence of the factories. We can also speculate that there is a population center, probably Mistford, located to the south of the park as the factories would have access to labour.
The number of vehicles passing through the camping sites is about a quarter the number of vehicles passing through the entrances. Even after accounting for the fact that each vehicle passes through an entrance twice (entering and exiting), the lower number of vehicles observed at the camp sites indicates that not all vehicles visiting the park stop at a camp site. We also observe that vehicles Type 4, 5 and 6 do not visit the campsites. Ranger stops 0 and 2 are traversed by all types vehicles as they link 2 frequently visited check points - General Gate 1 and General Gate 2. We observe that the number of visits to camping 1 is significantly lower than the other camping sites. It might be located on hard to access terrain or there are simply no attractions there. General gate 3 and general gate 6 have lower number of visits than the other general gates. This is due to their location outside of the main arteries connecting the park. In fact, visitors going through general gate 3 and 6 are headed to camping 8 and 7 respectively. Interestingly camping 7 and 8 are located along the path instead at the end of the path like the other camping sites.
The most popular gates are:
- General Gate 1
- General Gate 2
- General Gate 4
- General Gate 5
- General Gate 7
- Ranger Stop 0
- Ranger Stop 2
DAILY PATTERNS OF LIFE
“Patterns of Life” analyses depend on recognizing repeating patterns of activities by individuals or groups. Describe up to six daily patterns of life by vehicles traveling through and within the park. Characterize the patterns by describing the kinds of vehicles participating, their spatial activities (where do they go?), their temporal activities (when does the pattern happen?), and provide a hypothesis of what the pattern represents (for example, if I drove to a coffee house every morning, but did not stay for long, you might hypothesize I’m getting coffee “to-go”).
Ranger Patrols
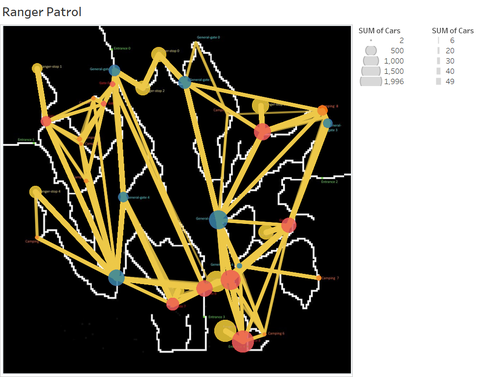
Ranger patrols are conducted by 2P vehicles. These vehicles start from the ranger base and move through all gates of the park, except the entrances and always return to the ranger base. Ranger vehicles obtain a new ID each time they head out from the ranger base on patrol - the alternative is that there is a large number of vehicles in the ranger base that the rangers only drive once, which is implausible . The rangers are most active between 6am and 6pm. There are no patrols between 3am and 6am. Patrols end earlier on Saturday night - there are no patrols between 1 am and 6 am, presumably the rangers are having their time-off. There are between 1-8 ranger vehicles on patrol in the park on any given day. From the sunburst diagram we can observe that the rangers have 4 patrol routes that they follow most of the time. 2 of these routes are long and head to the north west of the park. These routes are understandably longer as the ranger base is in the south east. Care has to be taken when interpreting sunburst diagrams as the area gets larger further away from the center
|

|
|
Transport Vehicles
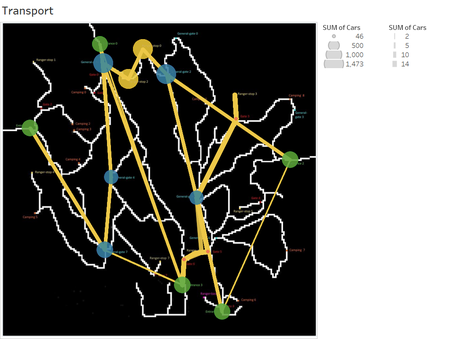
Transport vehicles of type 4, 5 and 6 pass through the park and do not stop at camping sites. They pass through the main arteries linking the entrances of the parks. Camping sites and other peripheral gates are avoided and the goal is to get from one entrance to the other. We observe that there is an anomaly where there are 4-axle trucks travelling to ranger stop 3, which we will study later on. The number of vehicles remains fairly constant throughout the day. Although vehicles type 5 and 6 are buses, they do not stop at areas of interest such as camping sites. There are several plausible explanations:
- Buses are not allowed to enter camping sites due to difficult terrain or to protect the wildlife
- These buses are passing through the park as a short cut or as a normal part of their journey and are ferrying people to and from areas outside the park.
Day Campers
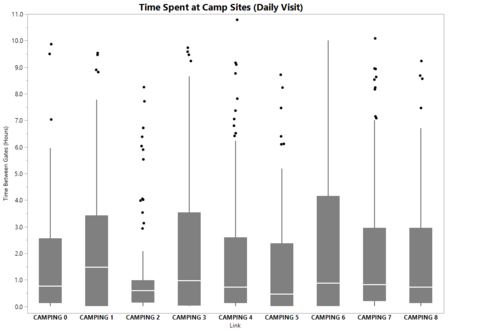
Day campers or short term campers in vehicles types 1,2 and 3 enter the 9 different camping sites throughout the day. They enter the various camping site for different activities and then leave on the same day as their entrance; they do not stay at the camping sites overnight. Their main purpose of entering the park is to spend time at the dedicated camping areas. The length of stay at the different camps varies. These visitors may not be camping but enjoying the natural attractions at the camping sites (lakes for example) instead. Their length of stay at the camp site varies from a few minutes up to 11 hours. We observe that the campers spend the shortest amount of time at Camping 2 |
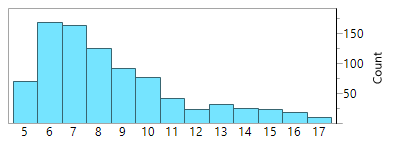
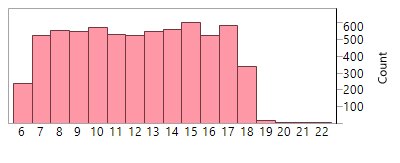
The day campers tend to arrive earlier in the day, before 10am as shown by the histogram plotting their count by the hour of entry into the camp site. Campers intending to only spend the day at a campsite would naturally plan to arrive early to maximize the time available for activities at the site before it gets dark and it’s time to leave. |
In Out Visits
These visitors are similar to the transport vehicles type 4,5 and 6 passing through the park without stopping at any camp site. They purpose of passing through the park could be either to :
- Have a leisurely drive through to enjoy nature or the scenery
- Commute to work or to another town and use the park like the other transport vehicles do
LONG TERM PATTERNS OF LIFE
Patterns of Life analyses may also depend on understanding what patterns appear over longer periods of time (in this case, over multiple days). Describe up to six patterns of life that occur over multiple days (including across the entire data set) by vehicles traveling through and within the park. Characterize the patterns by describing the kinds of vehicles participating, their spatial activities (where do they go?), their temporal activities (when does the pattern happen?), and provide a hypothesis of what the pattern represents (for example, many vehicles showing up at the same location each Saturday at the same time may suggest some activity occurring there each Saturday).
Seasons
Plotting the number of vehicles by type and month, we observe that the park has a majority of visitors in from May to September. This indicates that the park would be located in the Northern Hemisphere as these corresponds to the warmer period of the year where there would be more wildlife to observe and more visitors (e.g. summer holidays). There is a peak in July for vehicles type 1, 2, and 3 (car, motorcycle, 2 and 3 axle truck). Similarly, the numbers of vehicles 4, 5, and 6 also peak around the same time. The number of 2P vehicles (park rangers) remains stable throughout the year. Visitors in vehicles 1, 2 and 3 are likelier to be leisure visitors who come and go independently when they please whereas vehicles 4 are likelier to be utility vehicles servicing the park (provision of supplies, trash removal, etc.) or just passing through the park as part of their larger route (e.g. transport vehicles). Buses of type 5 and 6 would ferry visitors to and from the park in larger numbers. The number of vehicles drops in December and January as it is winter, making it hard to navigate the park and the animals would be in hibernation.
Weekend Crowd
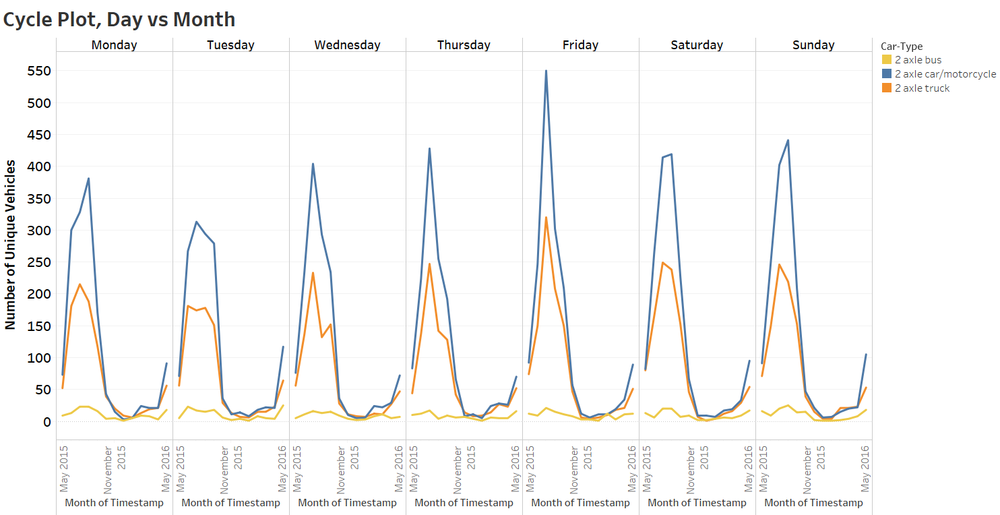
The number of vehicles entering the park increased on Friday, just before the weekend. Many vehicles of type 1,2 and 3 are entering the park to spend the week end there, as show by the cycle plot. The number of visitor is the lowest on Tuesday and Wednesday as it is the middle of the week. Visitors tend to take a day or two off on Friday and Monday to spend a long weekend in the park.
Overnight Campers
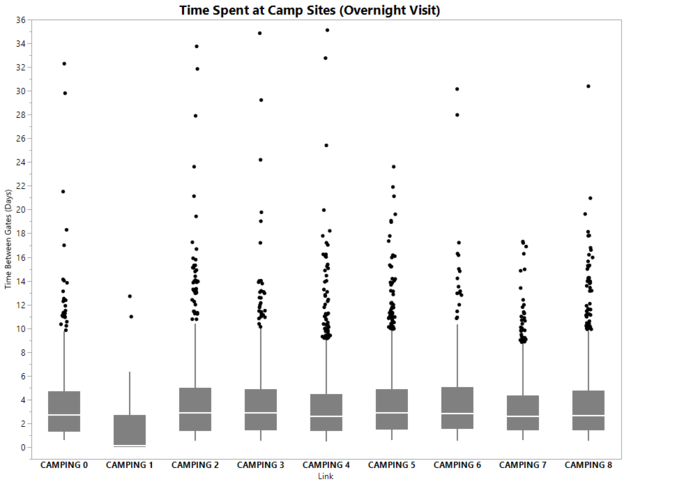
Over night campers arrive equally between 7am and 6pm. There are limited arrivals after 6pm as it would be dark and harder to set up camp. Overnight campers spend up to 35 days at camp sites. Camping site 1 has the shortest duration of stay. This is also the least visited camping site. It is possible that this is a remote camp site on difficult terrain. |
Repeat Visitors/Pass holders
When studying the sunburst diagram, we notice that there are visitors who exit and reenter the park with the same vehicle ID, for example 20154519024544-322, getting a total of 248 trip sequences. It appears that these visitors have a season pass that allows them to do so. This should be verified as even the park rangers receive a new vehicle ID everyday. This vehicle always heads to camping site 4 and enters from entrance 3. The vehicle stays at the camp site for a few days. This could be a tour guide vehicle bringing tourists to the same spot every time or a person who habitually goes to camping site 4 on the weekend. |
ANOMALIES
Unusual patterns may be patterns of activity that changes from an established pattern, or are just difficult to explain from what you know of a situation. Describe up to six unusual patterns (either single day or multiple days) and highlight why you find them unusual.
Unauthorized access to Ranger Stop 3
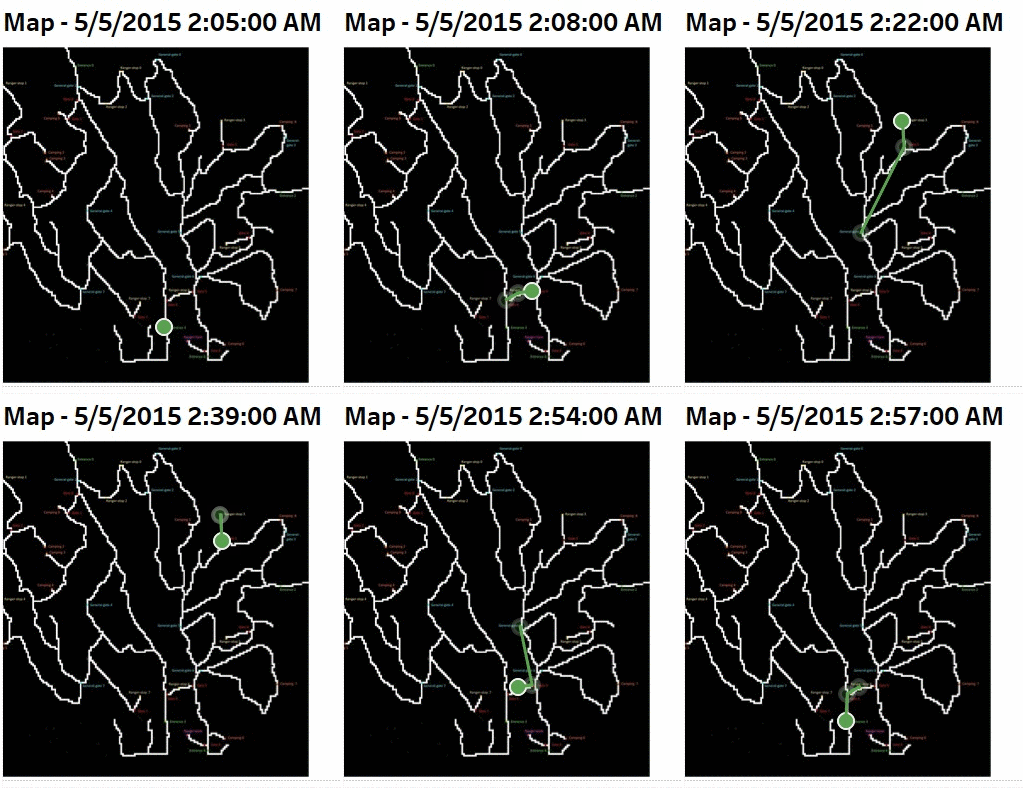
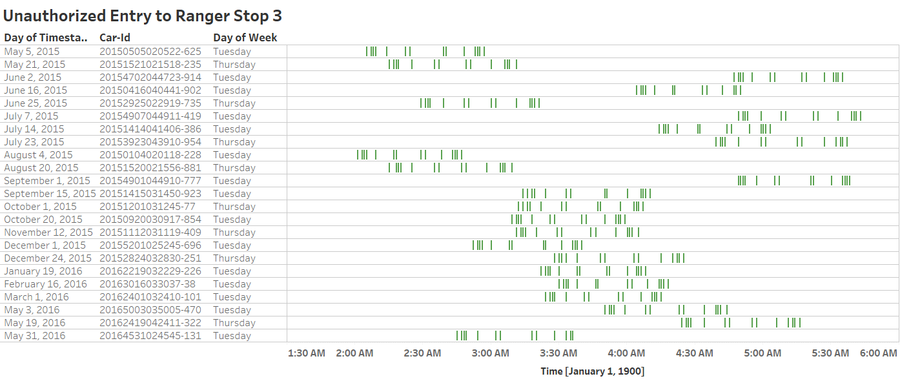
A vehicle is entering the preserve from entrance 3 and entering ranger stop 3 in the middle of the night. This occurs on Tuesdays and Thursdays and seems to be specifically timed to avoid ranger patrols. The vehicle stops at ranger stop 3 for about 15 minutes and then makes its way back to entrance 3.
Skipping Gates
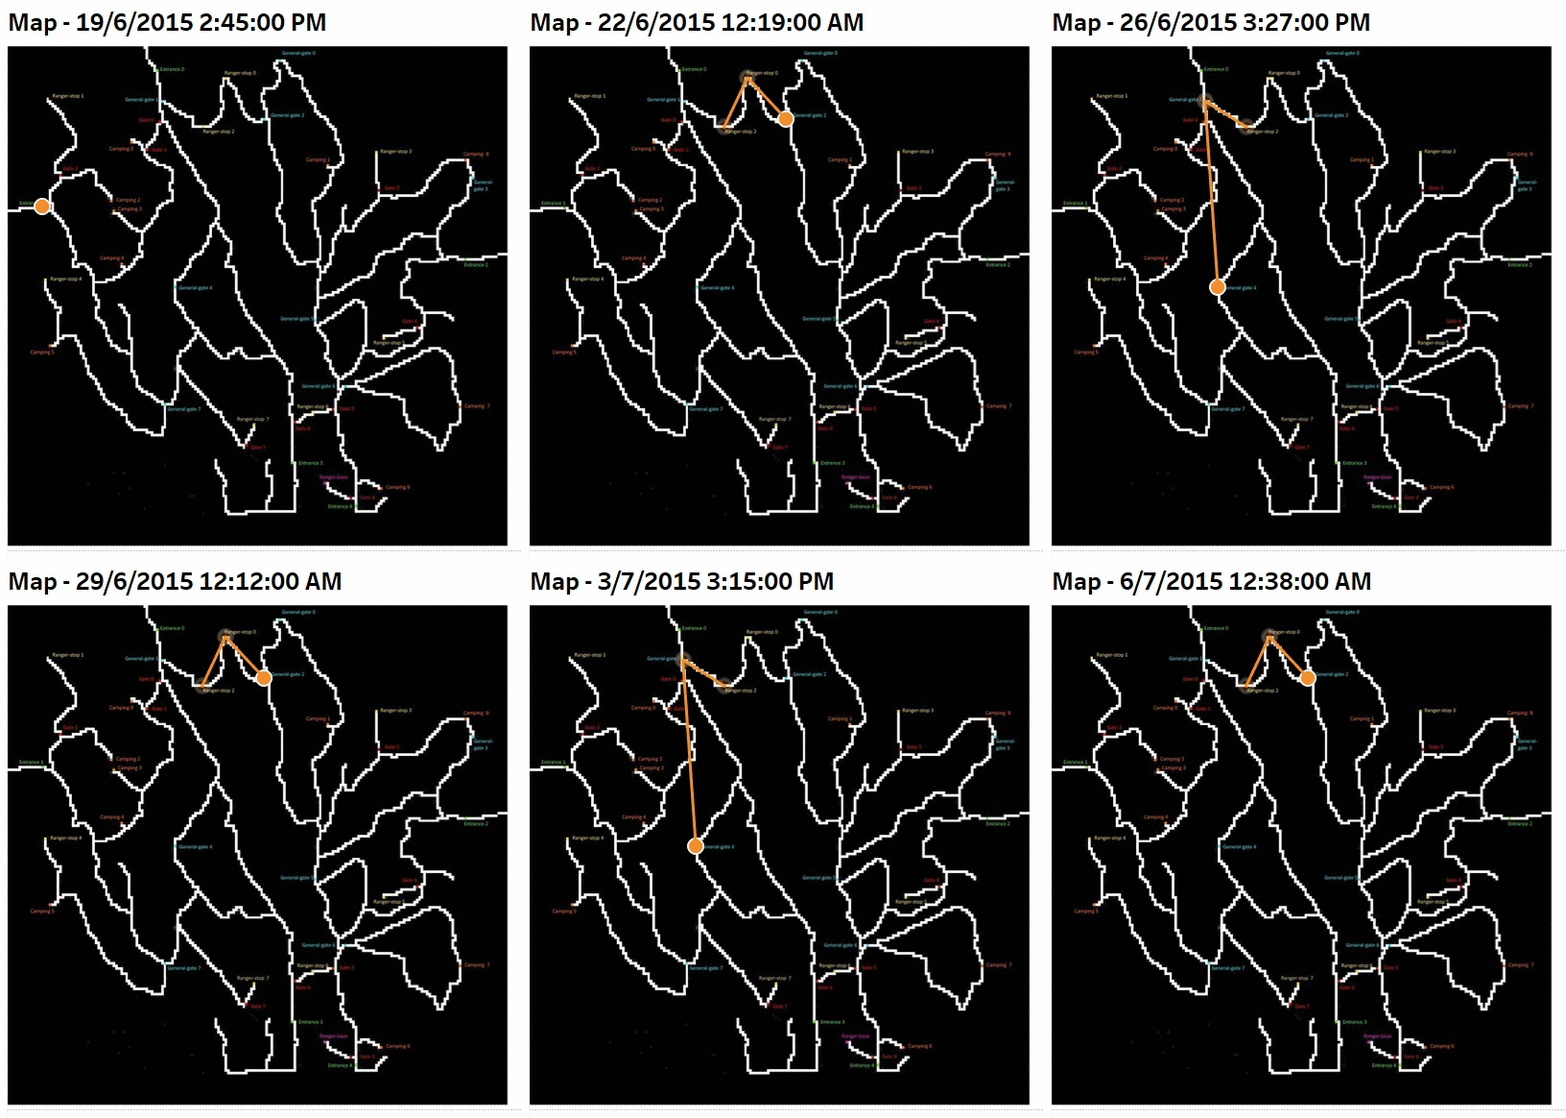
6 class 2 vehicles pass Entrance 1 together around 10 am on Friday 10th July 2015 and proceed directly to Ranger Stop 1. A normal route would go through Gate 2. They have traveled outside the permitted path. These vehicles leave at separate times on the same day. It is possible that this is a group of motorcycles or cars having a "joy ride" around the park. They also entered a ranger stop, which would be a sensitive area of the park.
Speeding?
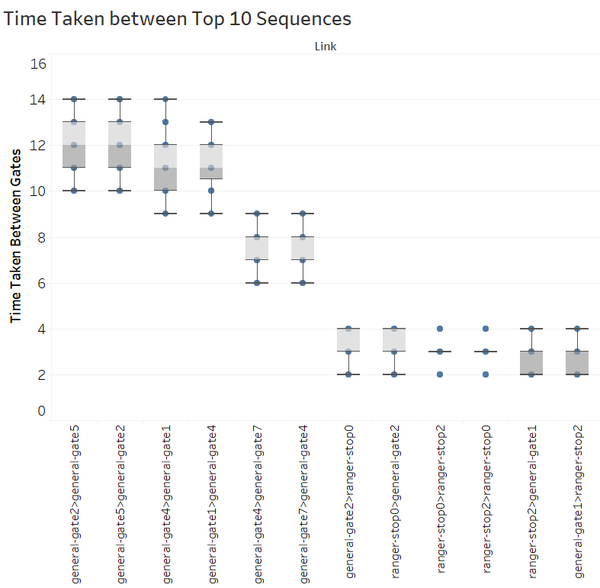
Vehicles travelling too fast, or even at the speed limit could cause a lot of noise and disturb the birds nesting. The boxplot for the top 10 gate sequences are shown. The lenght of each path is required to analyze if the speed is violated.
Multiple entries
When studying the sunburst diagram, we notice that there are visitors who exit and reenter the park with the same vehicle ID, for example 20154519024544-322, getting a total of 248 trip sequences. We need to verify if it is possible to get a season pass. Even ranger patrol vehicles get a new vehicle ID everyday even though they are stationed inside the park and have to patrol regularly. If this is not a season pass, it might be a forged or hacked entry pass |
Top 3 Impact to Wildlife
What are the top 3 patterns you discovered that you suspect could be most impactful to bird life in the nature preserve?
- There is heavy traffic passing through the main arteries of the park and this also continues at night. This will disrupt the peace in the park. The birds will have a hard time to rest and nest around the areas with heavy traffic.
- There are 4 axle trucks entering a restricted park area. The vehicles are coming from the Mistford Industrial Area and only staying for 15 minutes. This would be enough time to load or unload goods or people. If there is dumping of pollutants in the park this can affect the birds as they are among the smallest animals and the most sensitive to pollutants.
- There are vehicles that skip certain gates and enter restricted areas together. We only have an example where they entered the park properly but then proceeded to skip gates. It is possible that there are vehicles entering by completely by-passing the entrance gate and not getting a vehicle ID at all.
Future Improvements
Further improvements can be made with more time and resources. Attempts were made to extract the exact path using Tableau tools.
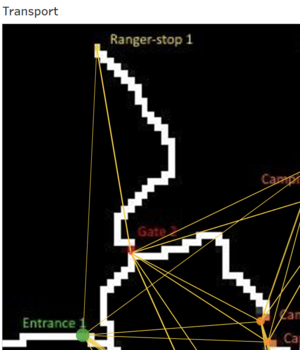
In particular this tool , which is used to extract polygons from images can be used to extract the path as well. However, for our visualization, there are many trajectories from gate to gate that go over the same path. As such attempts were made to avoid overlapping path sequences for readability. In addition, movement from the same gate was modeled as a 'circle'. Unfortunately the final result was more confusing than helpful. There are too many sequences travelling on the same physical path.
|
|

| |
| Expectation | Actual Result | Actual Result Enlarged |
In addition, having extracted the actual path, we would be able to calculate the actual distance instead of relying on the Euclidean distance, has hence better calculate if the vehicles are really speeding or not.
References and Feedback
References
Creating Path Diagrams in Tableau
https://public.tableau.com/en-us/s/blog/2015/07/taking-path-function
http://onlinehelp.tableau.com/current/pro/desktop/en-us/help.htm#maps_howto_origin_destination.html
https://community.tableau.com/thread/122366
Creating Sunburst Diagrams in Tableau
https://public.tableau.com/profile/bora.beran#!/vizhome/RadialCharts-Part2/RadialTreemap
https://www.youtube.com/watch?v=GEf-k5iPAW8&t=236s
https://www.youtube.com/watch?v=N7DacIDqQbo
Others
https://tableauandbehold.com/2015/04/13/creating-custom-polygons-on-a-background-image/
Feedback
Feedback #1
Hi David,
First of all, great job on the challenge. Like the way you have provided kind of interactivity through the GIFs , without the usual filters and dropdowns.
My two cents on the aesthetics and clarity part.
Clarity:
- The maps are clear, and they illustrate the hotspots of activity at different camping sites, etc. However, on the last image under Data exploration (Map), your colours for the gate type legend seems to be in grayscale, and missing in subsequent maps. This might be something you need to edit?. And why are both legends named Sum of cars? You might be needing to format those titles a bit.
- I like the graphic on repeat visitors, allows the user to see that the same car enters multiple times. However, your description on the right of the figure says ‘when studying the sunburst diagram..’. Not sure if this was intended for later addition by you?
Aesthetics:
- The strips for showing unauthorized entry to ranger stop 3 illustrate a pattern, which is effective and consumes minimal data ink. Very innovative to use that instead of just labels.
- On the weekend crowd cycle plot, since you want to infer the last 3 days of the week have higher traffic, you might want to push Sunday to the right side, so that all weekends are on side and all weekdays on the left, so that user reading from left to right can see the surge beginning on Fridays all the way to Sunday.
- The 'traffic on gate plot' I feel is a bit crowded with colours, maybe you want to use a hue to illustrate the car types? Or add it as a separate column and then sort for each gate, so that it is easily readable which car is found the most at which camp site, etc.
Hope they help. Do take time to drop in your feedback on my page as well! J
Thank You,
Kishan


