ISSS608 2016-17 T3 Anuthama Patterns of Life
|
|
|
|
|
|
|
|
Patterns of Life - Daily
I start off the analysis by observing the daily overall traffic patterns and flows. This would be the starting point to understand the car movements across the preserve.
Pattern 1: Peak Time
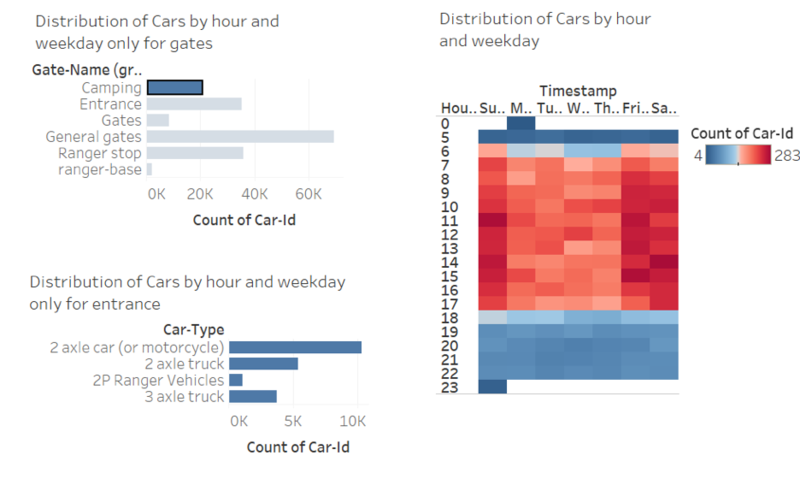
- 6 am – 6 pm are the busiest hours for the preserve.From 6-8 am the count of cars inside the preserve increases sharply and from 6-8 pm the number of cars decreases
- This plot also shows that Friday-Sunday are busier. This is probably due to weekend visitors or weekend campers
Next I analyse the traffic at the different gate types in order to drill down on the traffic patterns and flows. I have called out only the interesting findings. Other gates though analysed have not been reported.
Pattern 2: Movement at Camping Sites
- From 11PM – 4 AM, there is almost no movement at camp sites. The camping gates are probably closed during these hours.From 7 AM – 5 PM there is increased activity around camp sites
- The plot reveals that camp sites are busy even during week days and not just weekends. We see a surge in time spent at camp site especially during weekends. This is in alignment with the overall increase in traffic during weekends
This dashboard enables us to explore the relationship between the gate types, car types that pass through the gates as well as the time related data (eg. how long the vehicle was at the gate and at what time of the day).Here I have filtered the gate type for camps revealing the distribution of car types only at camps and the time data related to camps
Pattern 3: Large Vehicles not seen at camping site
- By looking at the distribution of vehicles at camp site, we notice that there are no 4 axle (and above) truck,2 axle bus and 3 axle buses in the camping site. May be these large vehicles are not allowed to camp.
We noticed some noteworthy findings at the gates
Pattern 4:Movement at Gates + Intrusion Alert
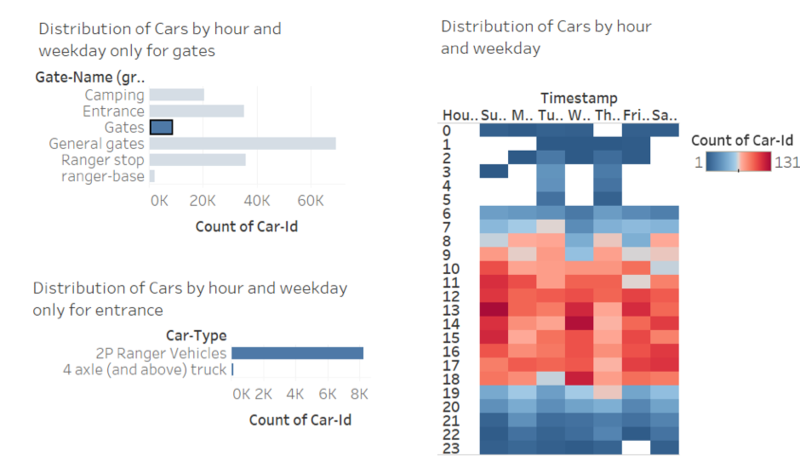
- Gates are sparsely used form 12 AM – 5 AM.We see a surge on Wednesdays .
- There is also an intrusion of gates by 4 axle(and above) truck. We will discuss this in Q3.
Pattern 5: Park Rangers Daily Patterns
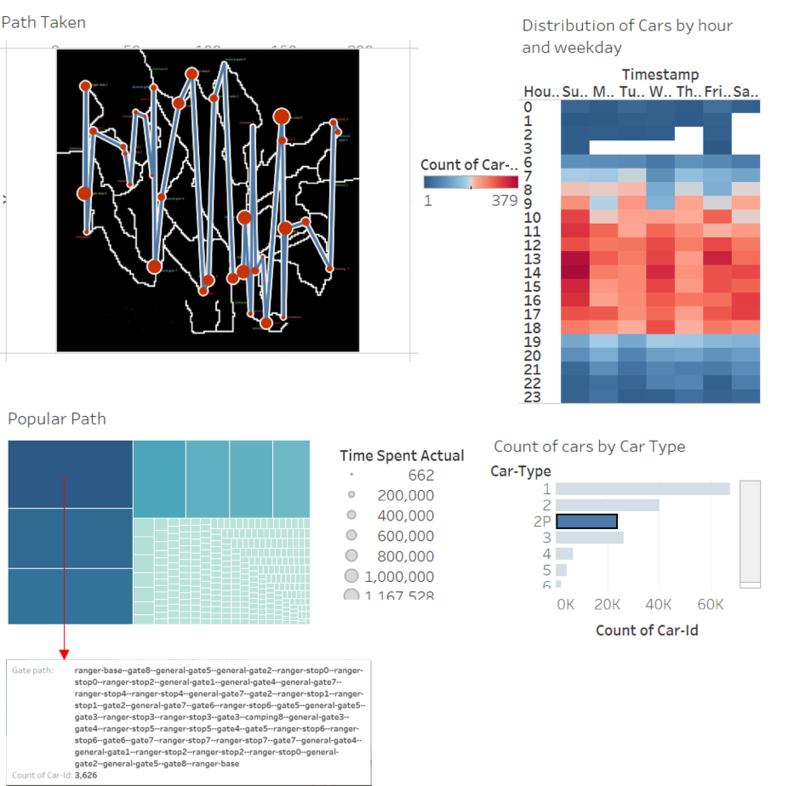
- This dashboard shows that 2P – Park Service Vehicles used by preserve rangers is not detected between 3-5 AM on all the days,2-5 AM on Thursdays, and 1-5 AM on Saturdays. These could be the Time off periods for all rangers. We notice a pattern here. This could mean that these timings are not patrolled.
- We can also see the path that was most frequent among 2P-Park service vehicles.
Pattern 6: Over used pathway
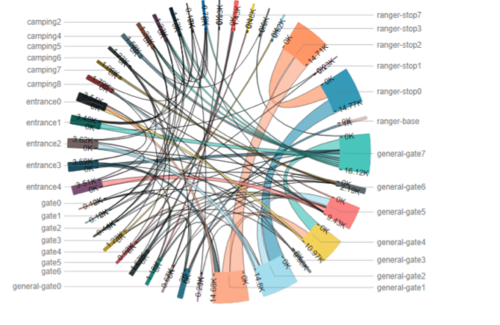
- The following are the commonly used pathways:
- Ranger-stop 0 --> General gate 2[7490] - General gate 2 --> Ranger -stop 0 [7311]
- Ranger-stop 2 --> General gate 1 [7427] - General gate 1 --> Ranger-stop 2 [7248]
- Ranger-stop 0 --> Ranger-stop 2 [7463] - Ranger-stop 2 --> Ranger-stop 0 [7284]
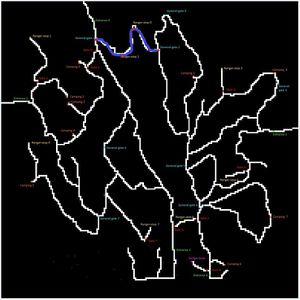
Quick look at where they are on the map. It is interesting to note that these 4 gates fall on the same road. Also there seems to be only 2 pathways that connect the East and West sides of the park. They are:
Pathway 1: General Gate 1 -->Ranger Stop 2 -->Ranger Stop 0 -->General gate 2
Pathway 2: Gate 6 --> Ranger stop 6 --> Gate 5
Since the pathway through the gates is restricted only Pathway 1 is available to the public if they wish to move from East to West or vice versa


