ISSS608 2016 17 T1 Project Team 7 Report
|
|
|
|
|
Contents
Motivation
TalkingData, China’s largest third-party mobile data platform, understands that everyday choices and behaviors paint a picture of who we are and what we value. Currently, TalkingData is seeking to leverage behavioral data from more than 70% of the 500 million mobile devices active daily in China to help its clients better understand and interact with their audiences. In this project, we are challenged to visualize users’ demographic characteristics based on their app usage, geolocation, and mobile device properties. Doing so will help millions of developers and brand advertisers around the world pursue data-driven marketing efforts which are relevant to their users and catered to their preferences.
Review and critic on past works
Design framework
Age Segment
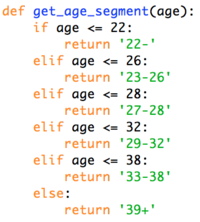
In the first step, we will first transform the age of users into nominal attribute. This would be helpful when we want to get better understanding of our users by age groups.
The graph shown below is a basic

Get Location
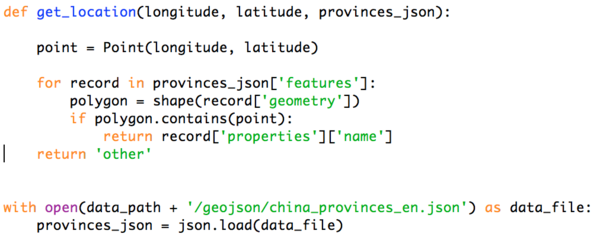
In the second step, we would like to get the geographical information of all events. To achieve this, we’ll try to use a python library named Shapely. Below is a screenshot of how we do this in the source code.

Time Flag
In the third step, we ‘ll try to transform out time attribute into numeric attribute and put them in bags. This would helpful for us to make matrix for each user. Below is a screenshot of the key function of how we made it.

Ratio Matrix
After giving time flag to every event record, we can build user’s behavioral matrix based on this. To do so, for each user, we first count the number of events happened in each different time period. Then we build it as a matrix and normalize it to make the sum of each matrix as one.
Finally, we can get a matrix like this:

In the matrix shown above, the last row is users’ device id and others are the ratio of events happened in different time period.
With such a matrix, we can know our users are mainly using their mobile phone in which time period.
User Clustering
After build the ratio matrix, we can do a clustering for our users to put them into different groups. In this case, we use the K-means function of scikit-learn which is a Python library to achieve this. Basically, we’ve finally get three meaningful clusters, each cluster has different behaviour pattern compare with others. The details of this will be discussed in the insights part.
Demonstration
To visualize our data and get better understand of user’s behavior, we’ve built a dashboard to visualize the volume of events with certain conditions. The graph shown below is a screenshot of it.
There are six modules in this dashboard, people can interact with the dashboard to see the volume of events based on customize conditions.
In following chapters, we’ll try to explain each part of this dashboard.
Discussion
Future Work
Installation guide
User Guide
