ISSS608 2016 17 T1 Project Team 7 Proposal
|
|
|
|
|
Background
![]() Nothing is more comforting than being greeted by your favorite drink just as you walk through the door of the corner café. While a thoughtful barista knows you take a macchiato every Wednesday morning at 8:15, it’s much more difficult in a digital space for your preferred brands to personalize your experience. In this dataset we’ll try to visualize user behaviors in using mobile devices.
Our datasets are from TalkingData, China’s largest third-party mobile data platform, understands that everyday choices and behaviors paint a picture of who we are and what we value. Currently, TalkingData is seeking to leverage behavioral data from more than 70% of the 500 million mobile devices active daily in China to help its clients better understand and interact with their audiences.
In this project, we are challenged to visualize users’ demographic characteristics based on their app usage, geolocation, and mobile device properties. Doing so will help millions of developers and brand advertisers around the world pursue data-driven marketing efforts which are relevant to their users and catered to their preferences.
Nothing is more comforting than being greeted by your favorite drink just as you walk through the door of the corner café. While a thoughtful barista knows you take a macchiato every Wednesday morning at 8:15, it’s much more difficult in a digital space for your preferred brands to personalize your experience. In this dataset we’ll try to visualize user behaviors in using mobile devices.
Our datasets are from TalkingData, China’s largest third-party mobile data platform, understands that everyday choices and behaviors paint a picture of who we are and what we value. Currently, TalkingData is seeking to leverage behavioral data from more than 70% of the 500 million mobile devices active daily in China to help its clients better understand and interact with their audiences.
In this project, we are challenged to visualize users’ demographic characteristics based on their app usage, geolocation, and mobile device properties. Doing so will help millions of developers and brand advertisers around the world pursue data-driven marketing efforts which are relevant to their users and catered to their preferences.
Data Overview
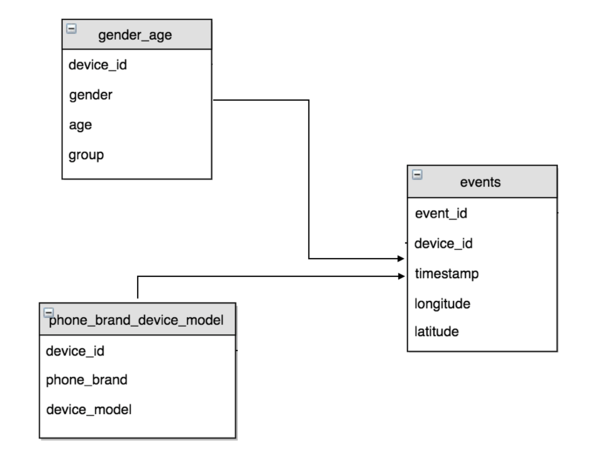
In this visualization project, we’ve three data sets. They contain about users’ personal information like gender and age; users’ device brand and model and information of users’ mobile events of a week between May, 1st, 2016 and May,7th,2016. And they are linked by one key attribute which is ‘device_id’. The data structure is shown as below:
To meet our objectives, we’ll first user these three sets to build an interactive dashboard with with which people can easily get the overview of users’ event distribution among different conditions. This would be helpful to understand cell phone users in China and give better market strategies. For the second task, we’ll use python to transform the events’ information to users’ behavior matrix and build clusters based on this. With these matrixes and clusters, we can get better understanding of when, where and which kind of people are using mobile phone.
Group Member
WAN Xulang; xulang.wan.2015@mitb.smu.edu.sg
XU Qiuhui; qiuhui.xu.2015@mitb.smu.edu.sg

