ISSS608 2016-17 T1 Assign3 Mukund Krishna Ravi Task 1
Jump to navigation
Jump to search
|
|
|
|
|
|
Question 1
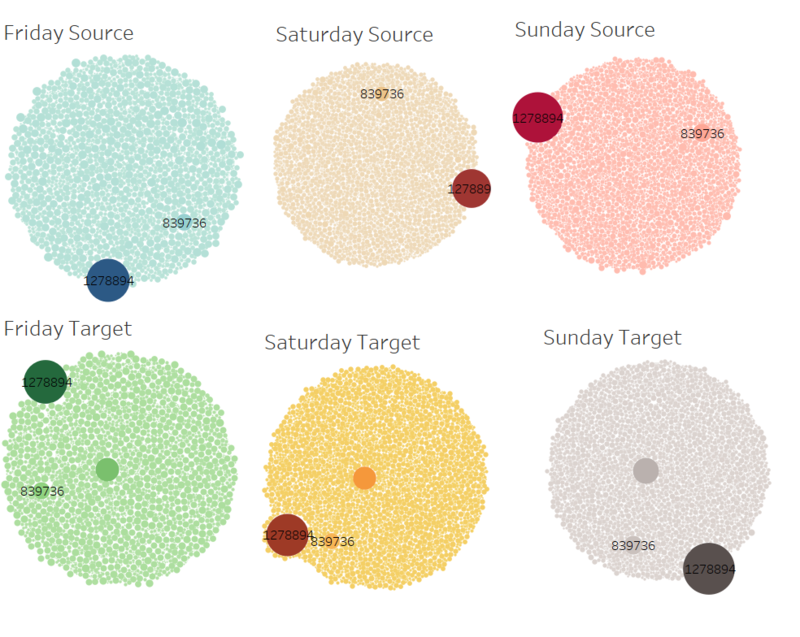
The main purpose of this question was to identify those ids with large amounts of communication volume. To identify this we analyse the following visualization
From the above visualization we notice that most of the IDs belong to 1278894 and 839736 across all dates in the source and target columns. These two ids seem to have the maximum communication coming in.
