ISSS608 2016-17 T1 Assign3 Mukund Krishna Ravi Task3
Jump to navigation
Jump to search
|
|
|
|
|
|
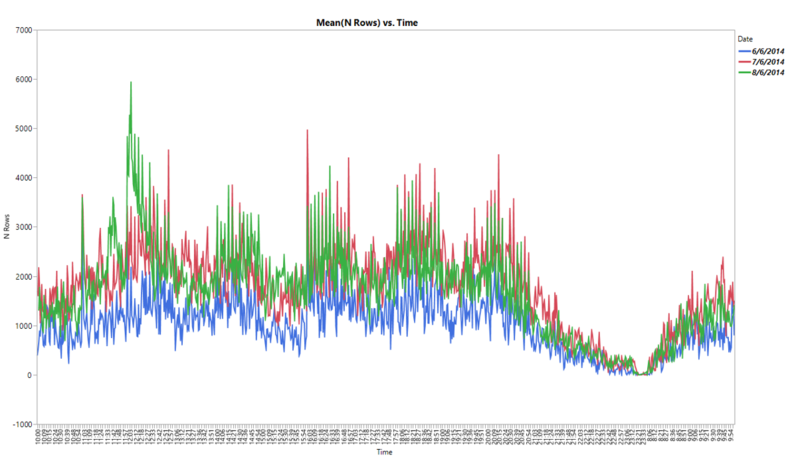
In this task we are asked to identify when and where did the vandalism occur. To understand this we plot the time series of each of each of the days to identify any spike in the time the vandalism occurred.
In the above graph we notice that the spike in the number of communications occurs on a Sunday. The time at which the spike occurs is at around 12:12 PM. There seems to be an excess of 6000 calls occurring at that time alone. This indicates that among all the days Sunday has the maximum number of outgoing calls. So most likely the perpetrators have been on a Sunday .
