ISSS608 2016-17 T1 Assign3 Lim Hui Ting Jaclyn - Data Exploration
| Main Page |
Contents
Data Exploration
Communication data on JMP
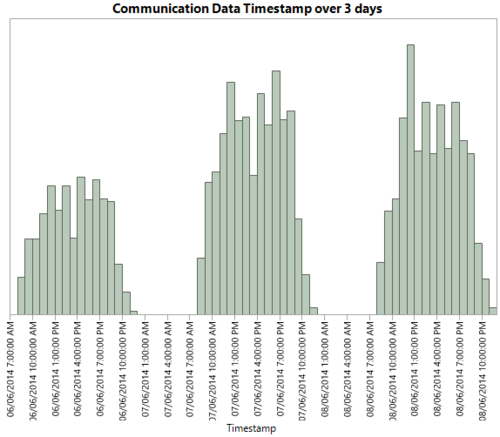
At the initial stage of data exploration, I analysed the communication data on JMP to look at the patterns of communication data.
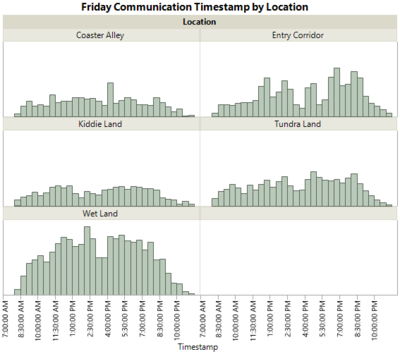
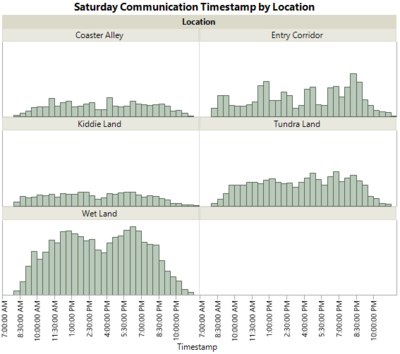
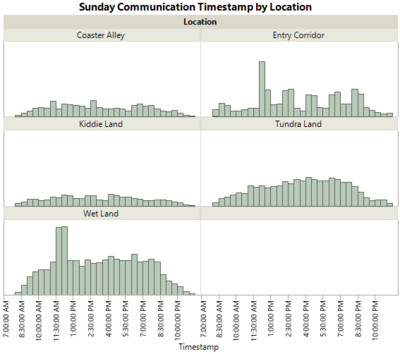
By comparing the three days, we can see that the communication data on Sunday has different patterns than that of other days. This is especially so in the location: Wet Land and Entry Corridor.
Communication data on Gephi
To analyse the types of networks on Gephi, I ran the "network diameter" option of "network overview" in order to create additional graph metrics to refer to. Here are the following graph metrics that I had explored.
Degree
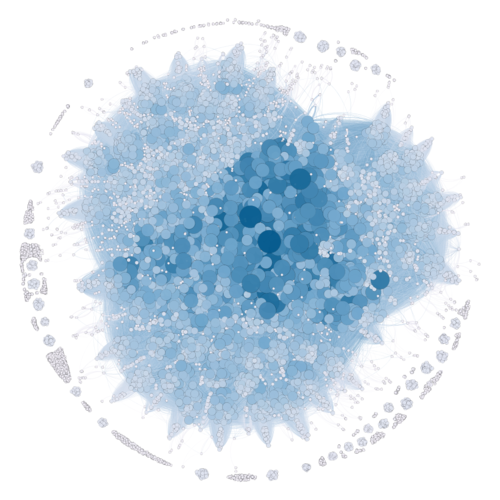
Degree represents the number of direct connections a node has. In the plot above, the number of direct connections take into account both the nodes the connected to, from and to the note. The nodes in the darker shade of blue, and of the largest size, represents those with the larger degrees.
In Degree
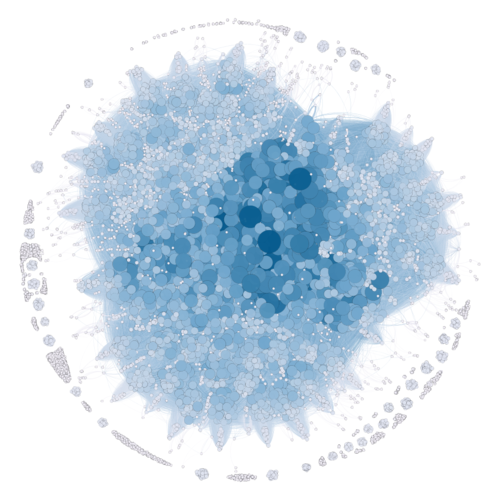
In the plot above, the darker and larger nodes represent those that have the largest amount of connection data towards them. In other words, many nodes are able to reach directly to this node.
Out Degree
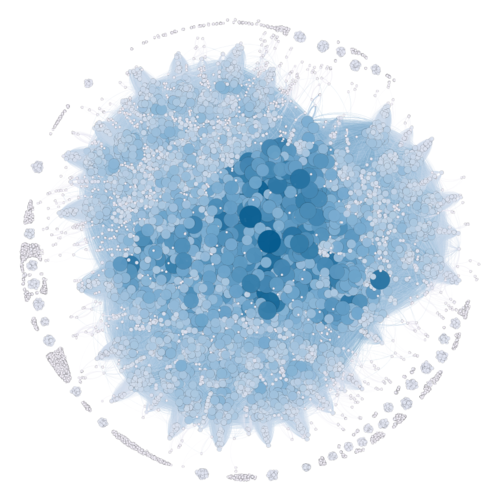
In the plot above, the darker and larger nodes represent those that have the largest amount of connection data flowing out of them. In other words, this node is able to reach out to many other nodes.
Betweenness Centrality
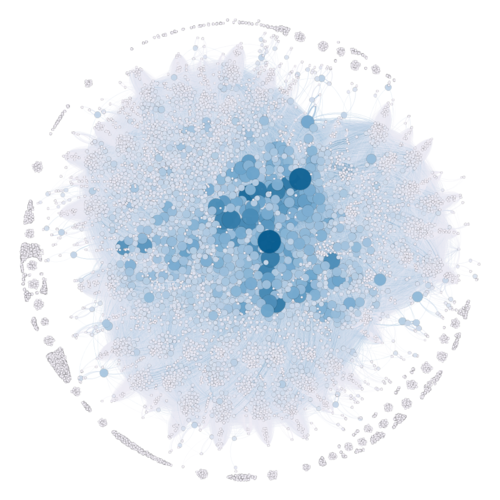
Betweenness is the centrality measure of a vertex within a graph. Nodes that have the shortest path to higher nodes have higher betweenness. As such, we can see that the nodes in the darkest shades of blue, and of the largest size, have the highest betweenness measures. This means that nodes with highest betweeness is more likely to have a direct connection with other people in the network.
The nodes with the highest betweenness centrality are: 983590, 968967, 1180958, 1944302, 248178. These represent nodes that are likely to have a direct connection with other nodes with many connections.
Closeness Centrality
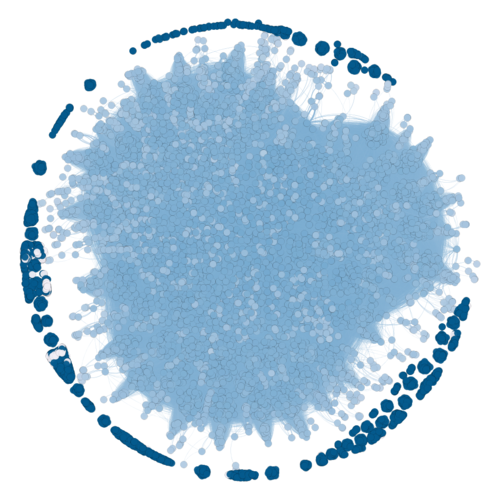
Closeness is also another centrality measure of a vertex within a graph. Nodes that have the shortest geodesic distance with other nodes in the graph have higher closeness. In the graph, the graphs that are of darker shades are have higher closeness, and can reach more people in the network more quickly.
It can be observed that in this graph, the nodes that are in the darkest shade are the ones that are the furthest away from the centre. In total, there are 3940 nodes that had a closeness centrality value of 1. This means that this group of people are closely knitted to their individual clusters, and are able to reach each other more quickly.
Eigenvector Centrality
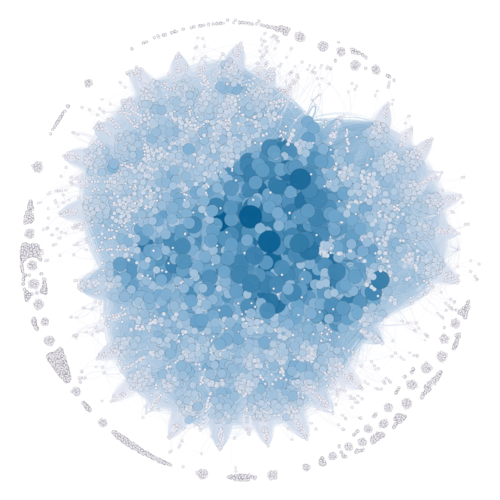
Eigenvector centrality measures the importance of a node in the network. This means that the scores that are assigned to the nodes are based on the principle that connections to high-scoring nodes contribute more to the score of the node in question than equal connections to low-scoring nodes. From here, we can see that the nodes with higher scores are in darker shades and are of larger sizes. This means that these nodes are connected to other well-connected nodes. The nodes with the highest Eigenvector Centrality values above 0.9 are: 1658699, 918404, 983590, 2091832, 1495961, 1735326 and 968967.
Conclusion from Data Exploration
We can see that there are various measures that can be used to observe the communication patterns within the dataset. A summary would be as follows:
- 3940 nodes with the highest closeness centrality values are located at the ends of the graph. They also have the lowest number of connections within the entire set. This means that they may have the shortest geodistance from the nodes that are the closest to them, but in fact, they are the furthest away from the nodes that have the most unique connections.
- The values with the highest betweenness centrality and eigen centrality values also have the highest number of unique connections. The highest number of unique connections being 1221, from ID 983590. This means that the central area of the graph tends to be made up of IDs that have a large number of connections with the rest of the nodes.
