ISSS608 2016-17 T1 Assign3 Assign3 Kee Bei Jia General Analysis
|
|
|
|
|
General Analysis
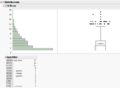
Like with any data analysis, we first look at distribution of the data. Specifically, looking at calls made and calls received each day. Generally calls made and received are in the low range with outliers. The max calls made was in the 60s to 90s range, and calls received in the 15s to 20 range.
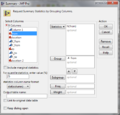
Summarize data
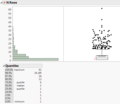
Distribution_Fri_Calls Made
Distribution_Fri_Calls Received

Distribution_Sat_Calls Made

Distribution_Sat_Calls Received

Distribution_Sun_Calls Made

Distribution_Sun_Calls Received


Looking at the data, the Top calls made or received for each day do not repeat. As in the Top caller for Sat is not the Top Caller for Friday or Sunday.
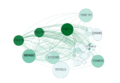
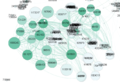
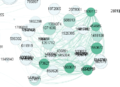
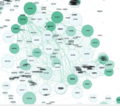
Looking at Gephi results, We can see that the communication graphs form small clusters among each each other as well as a larger clusters that made less communications in the center.

Friday All Gephi
Friday Subset Gephi 1: Suspects

Friday Subset Gephi 2: Suspects

Friday Subset Gephi 3: Suspects

Friday Subset Gephi 3: Suspects

Saturday All Gephi
Saturday Subset Gephi 1: Suspects
Saturday Subset Gephi 2: Suspects
Saturday Subset Gephi 3: Suspects

Sunday All Gephi 1


The Suspects are obtained using a subset of edges that have either the caller or person receiving the call have been to Wetlands or Coaster Alley at least once. The Color of the Nodes represents Out-Degree and Size represents In-degree. From the Charts we can see that very few nodes are both high in In and Put Degree.
The Sub set data for the Sunday data refused to move when i change layout in Gephi, as such it has not been done.
Further analysis that can be done if given more time: 1) Track the movement of the suspects across time 2) Find user who have not been on any rides 2) Find people who call each other within the same location