Difference between revisions of "SMT483G4: WheelGo Documentation"
Jump to navigation
Jump to search
Yschen.2017 (talk | contribs) |
Yschen.2017 (talk | contribs) |
||
| (12 intermediate revisions by the same user not shown) | |||
| Line 24: | Line 24: | ||
==User Profile Analysis== | ==User Profile Analysis== | ||
| − | [[File:Weekday.png|left| | + | |
| + | ===Data=== | ||
| + | |||
| + | In order to understand the wheelchair-users' travel behaviours, we find it necessary to exercise analysis on the user profiles. The available raw data includes: | ||
| + | <br/> | ||
| + | *Travel Distance per second | ||
| + | *24Hr Timing | ||
| + | *Travel Date | ||
| + | *GPS Data | ||
| + | <br/> | ||
| + | In order to get more meaningful outputs, we have used the available information to generate the following four variables: | ||
| + | <br/> | ||
| + | *Travel Speed | ||
| + | *Travel Duration | ||
| + | *Weekday | ||
| + | *Number of Travel Days | ||
| + | <br/> | ||
| + | |||
| + | ===Visualizations=== | ||
| + | |||
| + | Based on these variables, here are some examples of the diagrams we generated: | ||
| + | |||
| + | [[File:Weekday.png|left|500px]] | ||
| + | <br/> | ||
| + | [[File:AvgTimeDistance day.png|500px|thumb|left]] | ||
| + | <br/> | ||
| + | [[File:BoxWhisker Distance.png|500px|thumb|left]] | ||
| + | <br/> | ||
| + | [[File:Clustering.png|500px|thumb|left]] | ||
Latest revision as of 17:46, 15 March 2020

User Profile Analysis
Data
In order to understand the wheelchair-users' travel behaviours, we find it necessary to exercise analysis on the user profiles. The available raw data includes:
- Travel Distance per second
- 24Hr Timing
- Travel Date
- GPS Data
In order to get more meaningful outputs, we have used the available information to generate the following four variables:
- Travel Speed
- Travel Duration
- Weekday
- Number of Travel Days
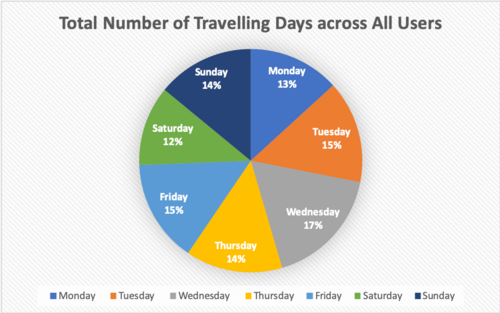
Visualizations
Based on these variables, here are some examples of the diagrams we generated:


